Every decision in oil and gas.
Data, analytics and predictive models for people making decisions about oil and gas assets. Built on data from millions of wells, from the subsurface up.

Three products.
Tessera Data is the foundation. Tessera Quest answers questions on it. The Tessera AI Engine forecasts, optimizes and values what it finds.
Tessera Data
The foundation.
Curated, analytics-ready upstream datasets across major U.S., Canadian and Argentine basins: well headers, production, lateral surveys, completions, permits, DUCs, landing zones, spacing, parent-child relationships and proprietary subsurface attributes, joined at the wellbore. Connect through the API or a direct database connection, or take the data as files or a scheduled feed, straight into your own systems, Spotfire, Power BI and Python.
- Well headers
- Production
- Lateral surveys
- Completions
- Permits and DUCs
- Landing zones
- Spacing
- Parent-child relationships
- Proprietary subsurface attributes
- API access
- Direct database connection
- Files and scheduled feeds
- And more
Tessera Quest
Ask the basin a question.
Ask a question in plain language and Quest runs it against every well Tessera holds: it builds the map, the chart or the valuation, benchmarks operators and zones, lists the wells behind an answer and watches the basin for you. Every number comes from Tessera Data, so it shows its work instead of guessing.
- Plain-language questions, answered from 4 million plus wells
- Maps, dashboards and production curves on demand
- Operator, zone and vintage benchmarks across basins
- Type curves and valuation for any selection
- Well lists you can map, copy or export
- Alerts on permits, spuds, completions and rigs
- Your own shapefiles, well lists and price decks
- Answers grounded in Tessera Data, not guesses
- And more
Tessera AI Engine
Models for every decision.
Train basin-specific models, then put them to work: forecast any well, explain what drives it, calibrate spacing and parent-child degradation, design the pad and the completion, run the economics and bid the deal. Every number carries its inputs, so a VP can sign off on it.
- Production forecasting from completion, geology and spacing
- Model insights: drivers, geo quality and residuals
- Spacing and parent-child degradation calibration
- Pad planner with gunbarrel design and well scoring
- Completion design optimizer
- Decline curves, type curves and DCF economics
- Remaining inventory and acreage valuation
- Deal flow: acreage and wellbore bids in minutes
- And more
See it running.
Tessera Quest running on Tessera Data. A real screen, real wells.
Meet Tessera Quest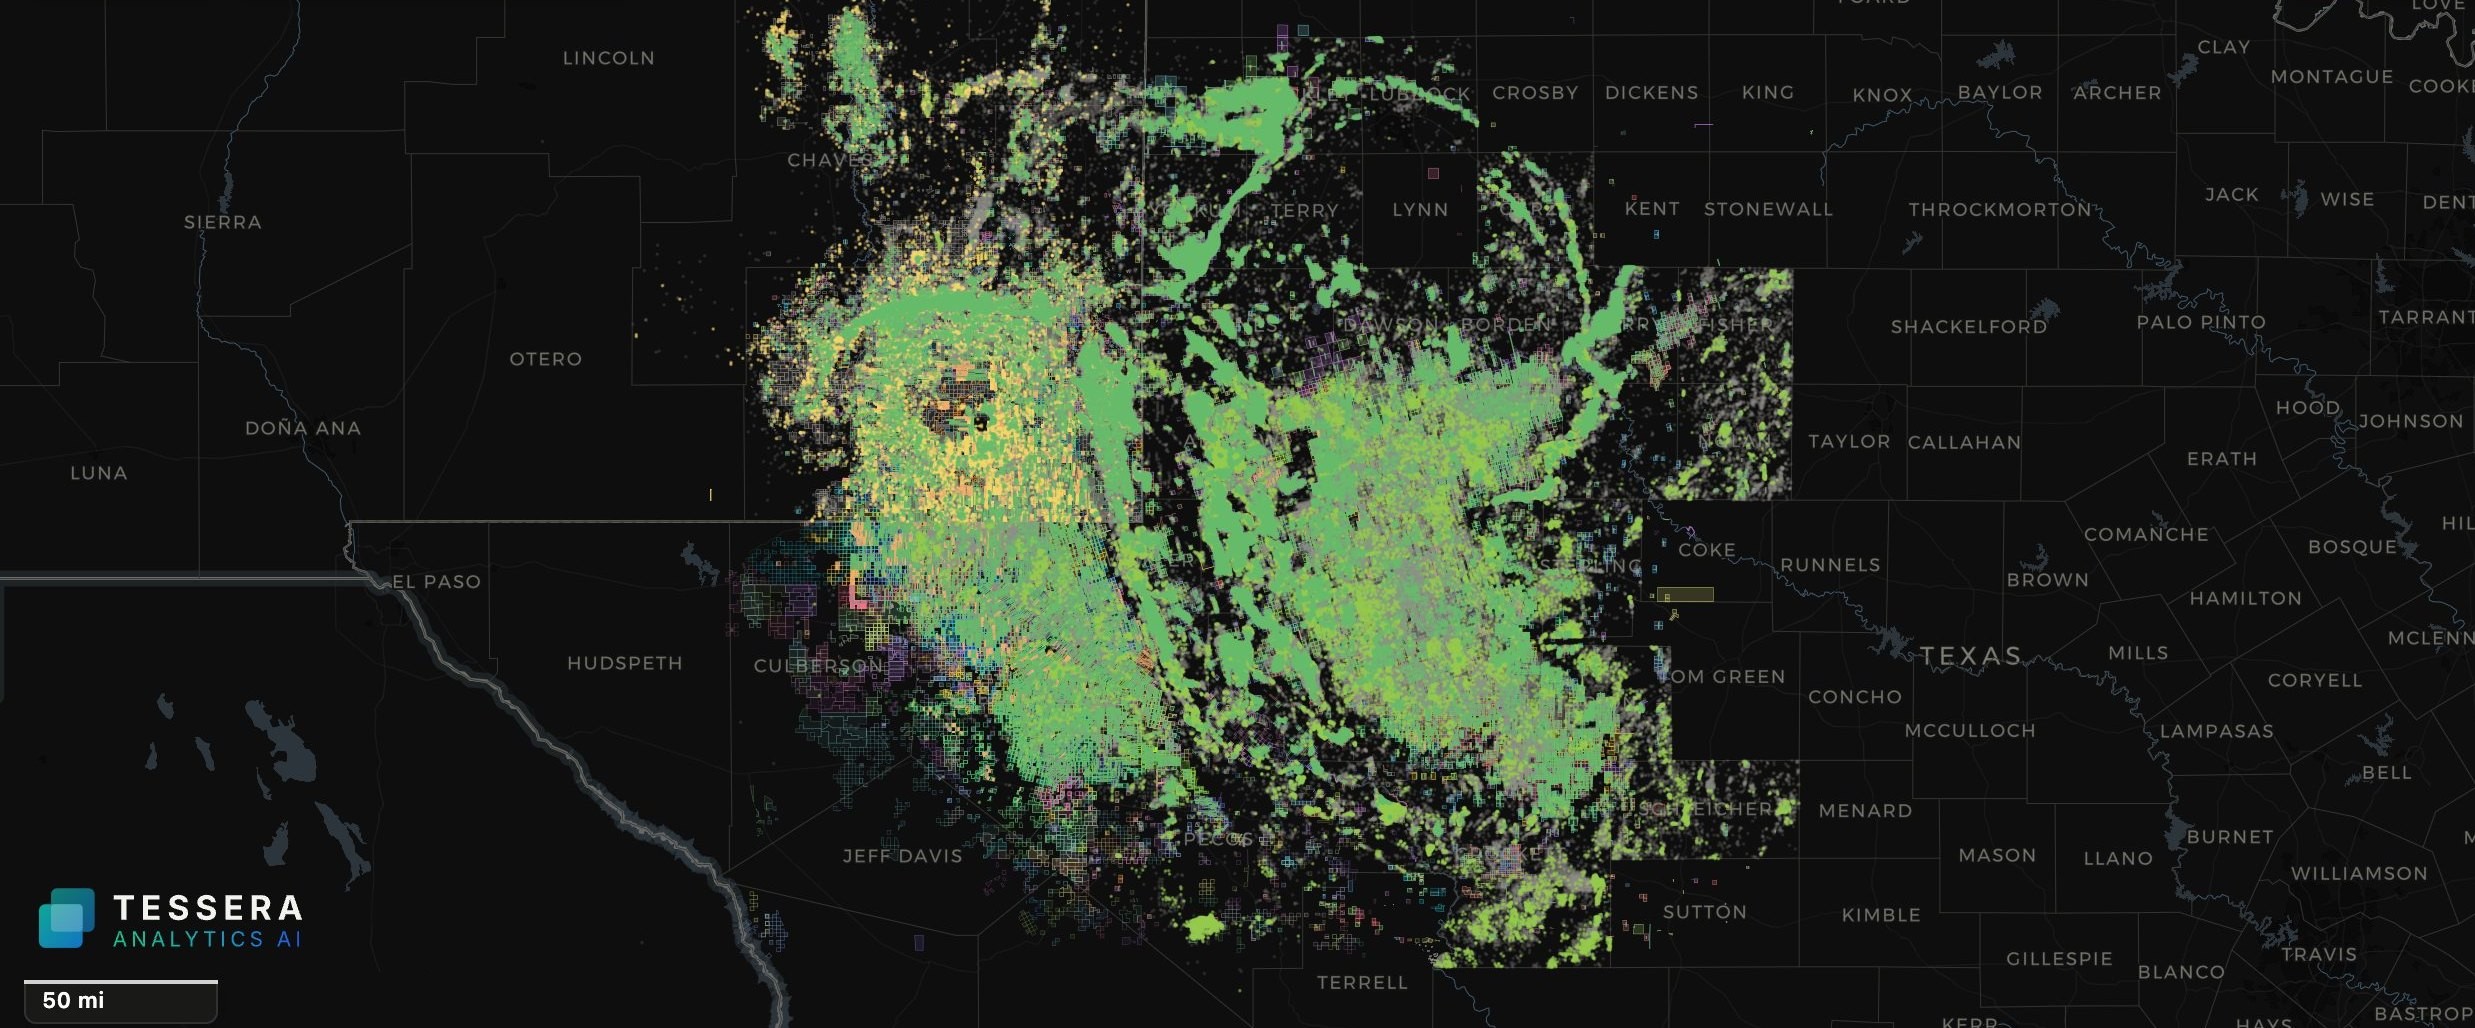
The whole basin in one view. More than 300,000 Permian wells colored by status: producing in green, permits in yellow, plugged in grey.
Millions of records.
One connected subsurface.
Wells, production, completions, geometry, geology, spacing, acreage, activity, inventory and economics, joined at the wellbore and refreshed as the states report.
Explore the dataWells & Production
Headers, status, allocated monthly production and derived rates.
Completions
Proppant, fluid, stages, intensity and design vintage.
Directional & Well Geometry
Lateral surveys, heel and toe, lateral length, TVD, azimuth and U-turn laterals.
Geology & Reservoir
Surface tops, thickness, structure, stress and rock quality attributes.
Spacing & Drainage
Measured spacing, parent-child relationships, drainage and encroachment.
Acreage & Land
Sections, leases, company acreage, mineral estate and comps.
Operators
Normalized operator entities, footprints, performance and pace.
Permits & Development Activity
Permits, DUCs, spuds, completions, rigs and first production.
Inventory
Remaining locations by bench, section and operator.
Economics
Costs, prices, taxes, differentials and valuation outputs.
Derived Intelligence
What Tessera computes from the raw data. The differentiated layer.
Don't just query the data. Understand it.


Explore
Every well and every attribute on a map you can question.
Analyze
Benchmarks, cohorts and drivers with the confounders removed.


Predict
Decline curves and machine learning, reconciled on every well.
From basin to section to well to decision.
The same data at every altitude. Zoom from the whole DJ Basin to one DSU without changing tools or losing the thread.


Built for every side of the asset.
Should we drill this section?
Forecasting, spacing, type curves and inventory for the asset team. Capital efficiency and portfolio answers for the executive floor.
Tessera for operators
What are our operating partners actually doing?
Track every AFE, permit and well across your interests. Benchmark the operators drilling them. Consent with the economics in front of you.
Tessera for non-operators
What is being developed around our minerals, and what is left?
Tract by tract: the wells, the operator, the benches developed and undeveloped, then a forecast and a value for the position.
Tessera for minerals
How many locations does this company really have?
Operator performance, inventory quality, basin exposure and capital efficiency, measured from the wells rather than the investor deck.
Tessera for investors
A Permian package landed in your inbox. See all of it before lunch.
Acreage, wells, offsets, production, inventory, forecasts and economics for any package, in one afternoon.
Tessera for advisors
What is happening in the basin this week?
Who is drilling, where, how the wells are performing and where activity is moving. A market terminal for oil and gas.
Tessera for intelligence
Open Tessera Quest every morning and ask: what is happening?
Watchlists, allocated production, activity and performance across the basin. The market terminal for oil and gas.
See the terminal Ask Tessera Quest.
Plain language in. Real analysis out, grounded in the same data and models the rest of the platform runs on.
Meet Tessera QuestFiltered 412 ExxonMobil horizontals over 10,000 ft in Lea County, 2019 to 2025, and 1,684 offset wells from other operators within 3 miles.
After normalizing to per-foot rates and adjusting for rock quality (thickness, TOC and Tessera's proprietary layers), ExxonMobil's 12-month oil is 8.6% above offsets in Wolfcamp A and 2.1% below in 3rd Bone Spring Sand.
The Wolfcamp A gap is explained mostly by completion intensity (about 5 points) and tighter parent-child timing (about 3 points). Map updated with both cohorts.

Upstream workflows Tessera supports.
Subsurface, development planning, production forecasting, A&D and asset evaluation, on one dataset.
- Well-level production forecastingMachine learning and decline-curve analysis on every well, reconciled against each other.
- Type curves and inventory forecastingPer-zone type curve sets from the operator's own recent wells, rolled into inventory forecasts.
- Remaining inventory and development opportunitiesBench-resolved inventory that knows which zones are developed, partially developed or untouched.
- Landing-zone, spacing and parent-child analysisStandardized zones, measured spacing and parent-child timing computed for every well.
- Drainage and well-interference assessmentVoronoi drainage, lateral-to-lateral distance, encroachment and the interference penalty that follows.
- Completion design and frac optimizationProppant, fluid, stage and lateral-length sweeps scored against a model before capital is committed.
- Geological and reservoir characterizationThickness, TOC, Tessera's proprietary layers and bench classification for every horizontal, developed or not.
- Automated well and acreage evaluationEvery well in a tract forecast and valued from its own history, every undeveloped location from its analogs.
- A&D screening and rapid asset valuationAcreage, wells, offsets, inventory, forecasts and economics for any package, in one afternoon.
- Mineral and non-op opportunity evaluationTract by tract: the wells, the operator, the benches left, then a forecast and a value for the position.
- Economic scenario analysis and development optimizationPrice decks, costs, spacing and pace as sliders that recompute NPV, IRR and breakeven instantly.
- Querying and analysis of large upstream datasetsAsk in plain language; Tessera Quest pulls the wells, runs the numbers and shows the map.
- Data delivery and integration with operator workflowsFiles, API or a private database, flowing into Spotfire, Power BI, reserves systems and Python.
What Tessera knows about your basin.
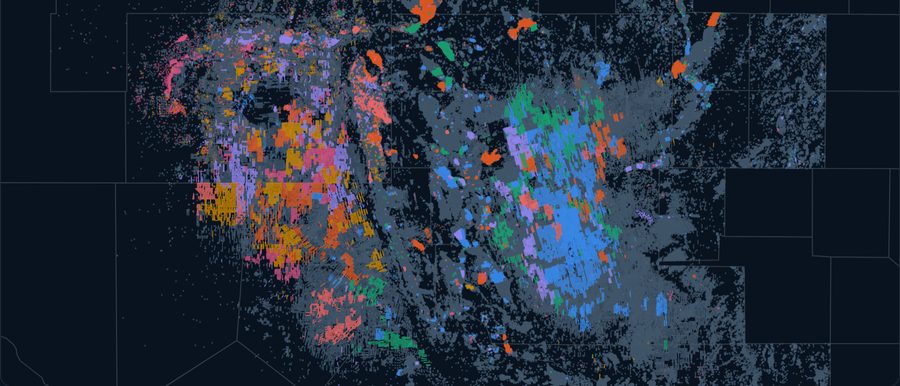
Permian
Texas, New Mexico
Tessera's deepest coverage. Every horizontal mapped, sixteen landing zones, allocated production since 2005, surveys for both states.
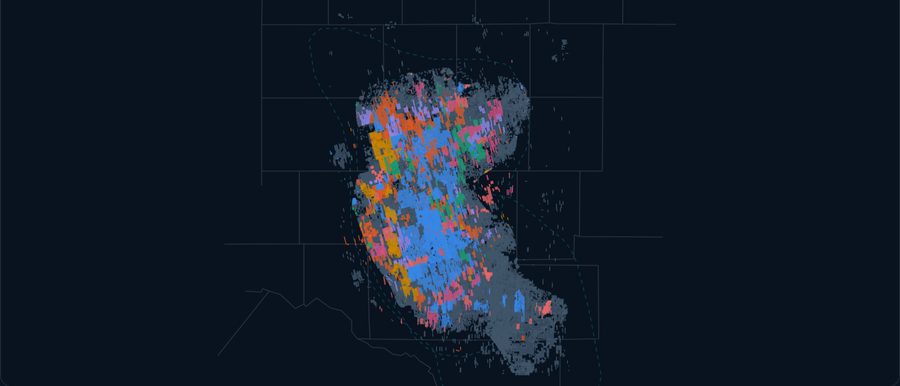
Midland
West Texas
The eastern Permian. Stacked Spraberry and Wolfcamp benches, the longest laterals in the basin and development that is now about spacing and sequence.
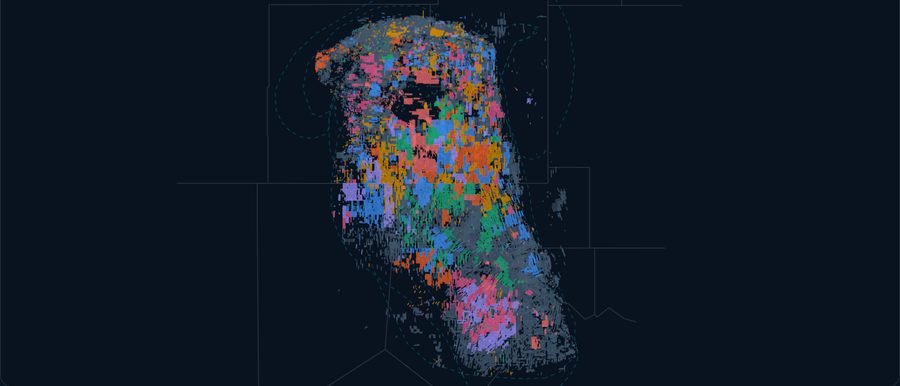
Delaware
West Texas, New Mexico
The western Permian. Bone Spring and Wolfcamp targets across the state line, with higher pressure, more gas and more water to plan around.
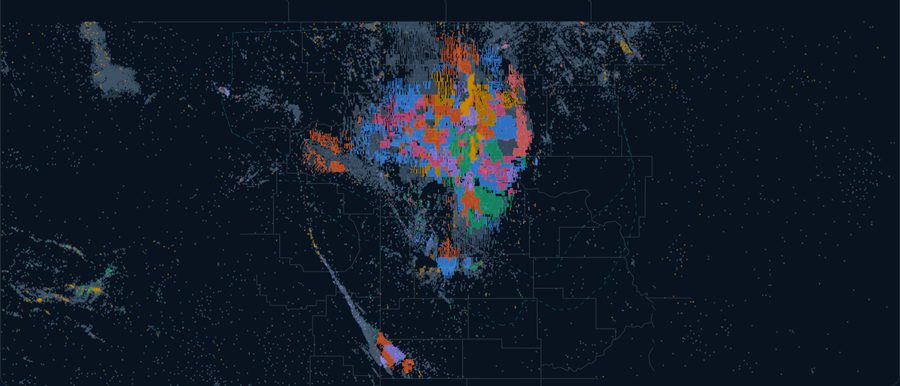
Bakken
North Dakota, Montana
A mature play where spacing, refracs and inventory depth are the questions that matter.
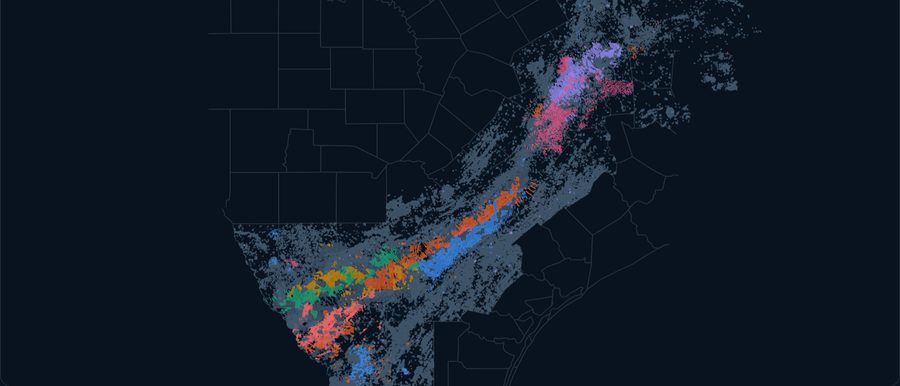
Eagle Ford
South Texas
Oil, condensate and gas windows in one play, with a resurgence in Austin Chalk activity.
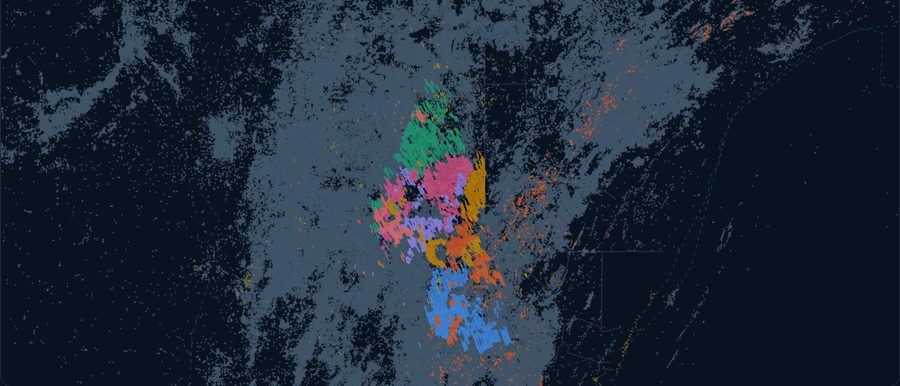
Appalachia
Pennsylvania, Ohio, West Virginia
The largest gas basin in the country, with a long history of long laterals and steady operators.
From the data, and from the road.
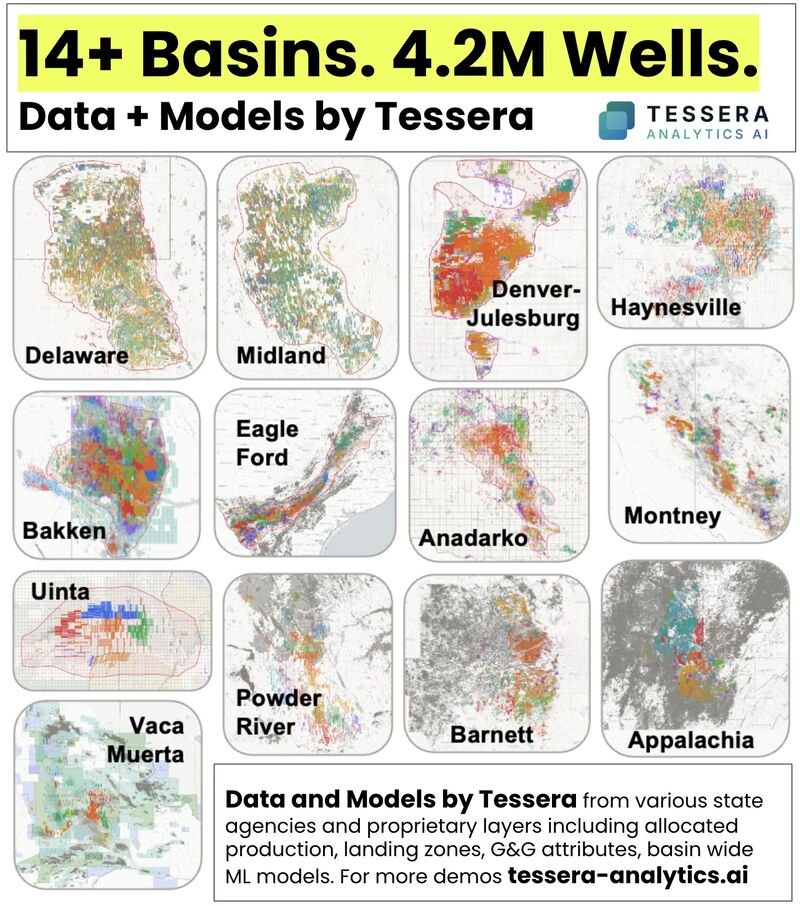
14+ basins. 4.2 million wells. And most of the models are already built.
A year of building Tessera basin by basin, and what is in it today.
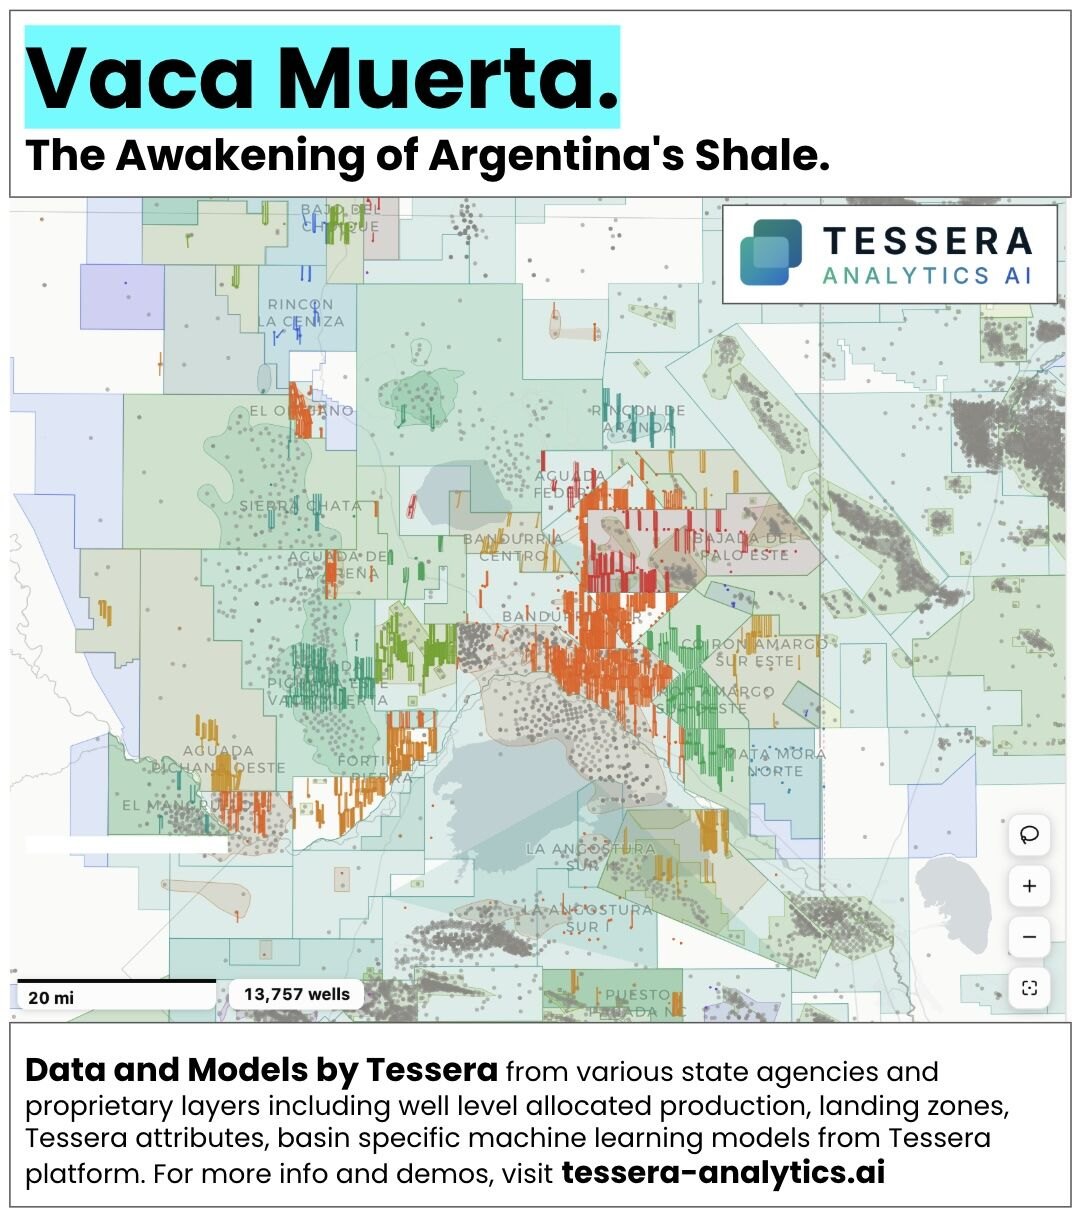
Vaca Muerta. The awakening of Argentina's shale.
The first basin outside North America on the Tessera platform.
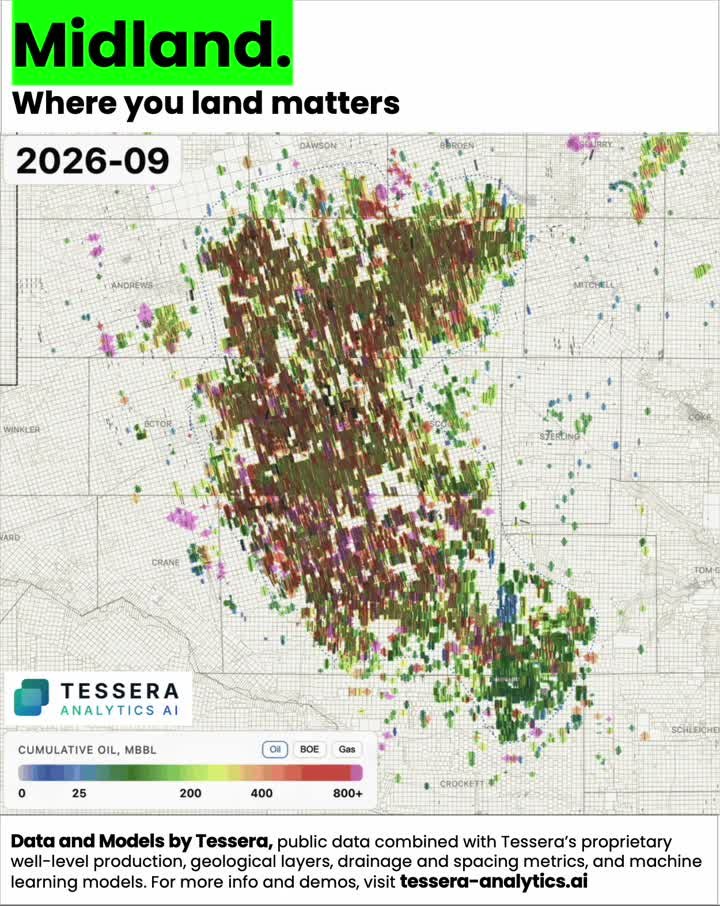
Not all Wolfcamp is equal.
Midland. Where you land matters.
See your wells and basin in Tessera.
A 30-minute walkthrough on your acreage, your operators or your deal. No slide deck, just the platform.