Resources / Blog & Insights

Things we found in the data.

Short studies, basin notes and platform walk-throughs. Each one started as a LinkedIn post, so the full thread, the video and the comments live there.

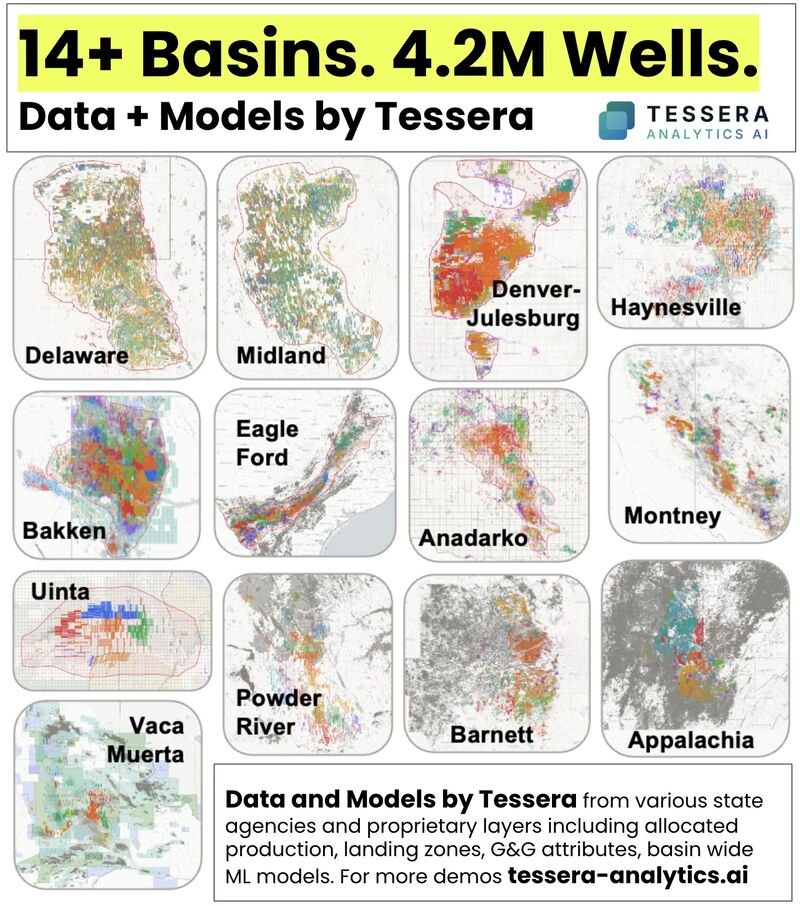
Grid of basin maps: Delaware, Midland, Denver-Julesburg, Haynesville, Bakken, Eagle Ford, Anadarko, Montney, Uinta, Powder River, Barnett, Vaca Muerta and Appalachia

14+ basins. 4.2 million wells. And most of the models are already built.

A year of building Tessera basin by basin, and what is in it today.

Over the past year, we have been building Tessera basin by basin. Not just well headers and production, but trajectories, allocated production, landing zones, our proprietary subsurface attributes, spacing and parent-child relationships, and basin-specific machine learning models.

The goal has always been simple: put the data and the intelligence on top of it in one place. Whether the question is where to drill, what a well should produce, how much inventory remains, or what an asset is worth, we want to get from data to decision in minutes, not weeks.

If your basin is on this map, there is a good chance we are already there.
More on LinkedIn
BasinsDataModels
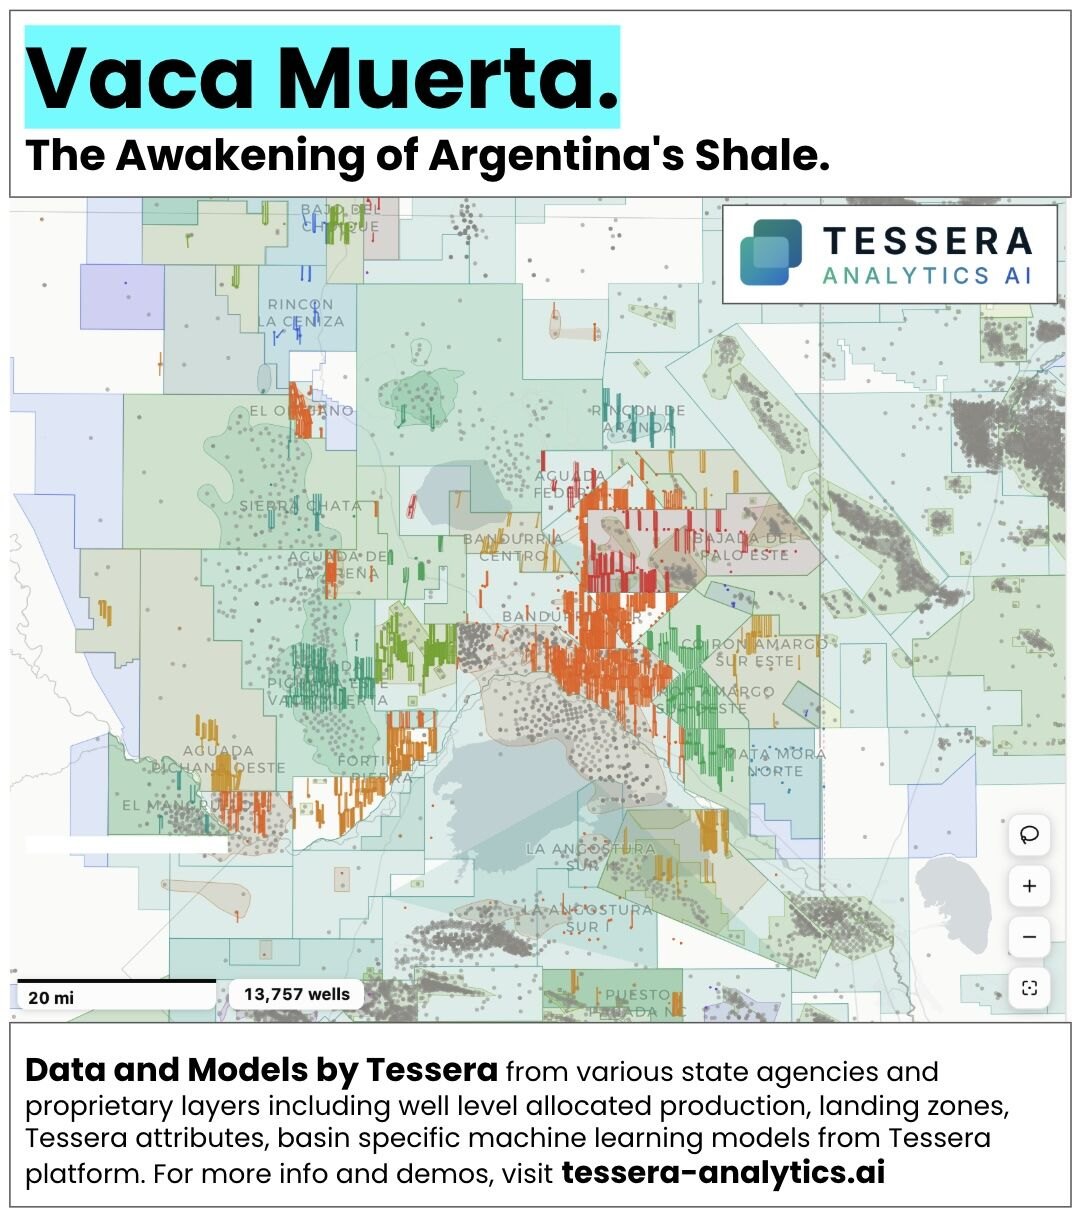
Map of Vaca Muerta wells and concessions in the Neuquen Basin

Vaca Muerta. The awakening of Argentina's shale.

The first basin outside North America on the Tessera platform.

Vaca Muerta is the first basin outside North America on the Tessera platform. What started as one of the world's great shale experiments is becoming a development story at scale. More wells, longer laterals, better completions, and more history to learn from with every year.

We are now bringing Vaca Muerta into the same data and modeling framework we have built across the U.S. and Canada, connecting well-level production, geology, landing zones, spacing, completions, and machine learning to understand how the play is evolving and where it goes next.

More on LinkedIn
Vaca MuertaBasins
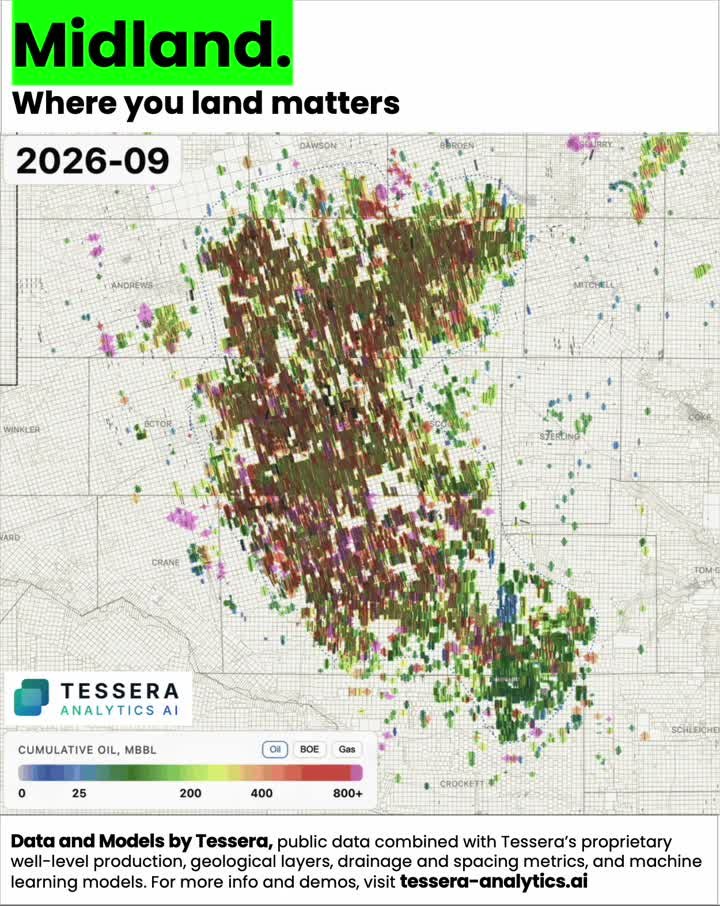
Midland Basin horizontal wells colored by cumulative oil

Not all Wolfcamp is equal.

Midland. Where you land matters.

Two Midland wells. Same operator. Same county. Same lateral length. Similar completions. Both are "Wolfcamp A." One can make significantly more oil than the other in year one. The difference can be just a few tens of feet of rock, or a few miles across the basin.

The Midland Basin is increasingly a developed-basin problem. Most new wells are no longer being drilled in isolation. They are surrounded by existing producers, above, below, and beside them.

And that creates an interesting trap in the data. Some of the most crowded wells also happen to sit in the best rock. Parent-child spacing, geoquality, landing position, completion design, and drainage are all tangled together.

More on LinkedIn
MidlandLanding zonesSpacing
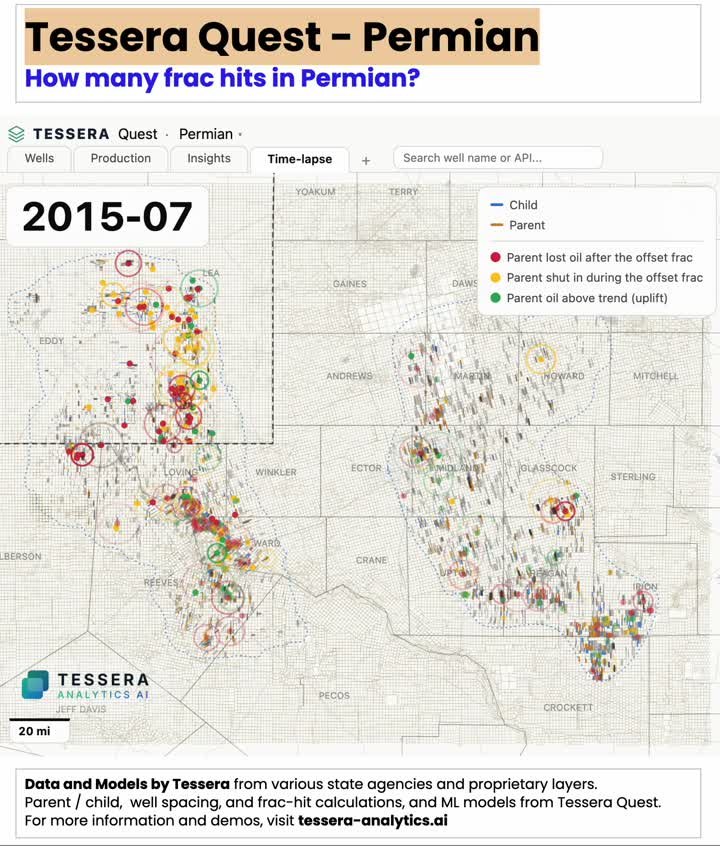
Tessera Quest time-lapse of Permian parent and child wells with frac hit outcomes marked

How many frac hits have happened in the Permian?

Sounds like a simple question. It isn't.

There is no record of the parent and child wells or frac hits anywhere that says: this well became a child. This well became a parent. The parent lost production after the offset frac. The parent was shut in during the frac, then came back. The parent came back stronger.

And parent-child relationships are just one example. The goal is not another database with more columns. It is data that already understands the basin.

More on LinkedIn
PermianParent-childTessera Quest
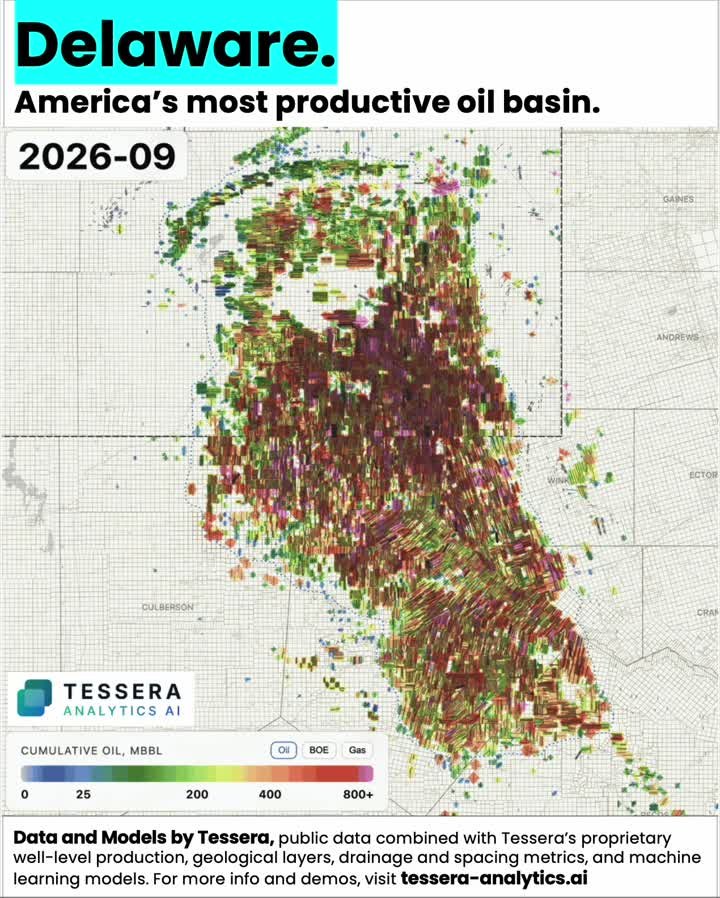
Delaware Basin horizontal wells colored by cumulative oil

The most productive oil basin in America is also the most crowded one.

And it does not act crowded. Yet.

Let's start with the size of it. More than 3.1 million barrels of oil per day in 2026 from roughly 25,000 horizontal wells. More than the Midland next door. More than the Eagle Ford and Bakken combined.

Now let's look at the crowding. In 2010, only 29 of every 100 new Delaware wells were drilled near an older well. In 2026, it is 91 of every 100. You would expect production to show it. It doesn't. Wolfcamp A wells drilled since 2019 with a nearby older well averaged about 22 Mbbl of first-year oil per 1,000 ft. Wells with no nearby older well averaged about 21.

The crowded wells aren't worse. Not yet. The reason may be hiding vertically. The Delaware has more than 10 producing landing zones stacked across roughly 3,000 ft of rock, and about half of the wells with an older neighbor have that neighbor in a different bench. Same section. Different floor.

More on LinkedIn
DelawareSpacingDrainage
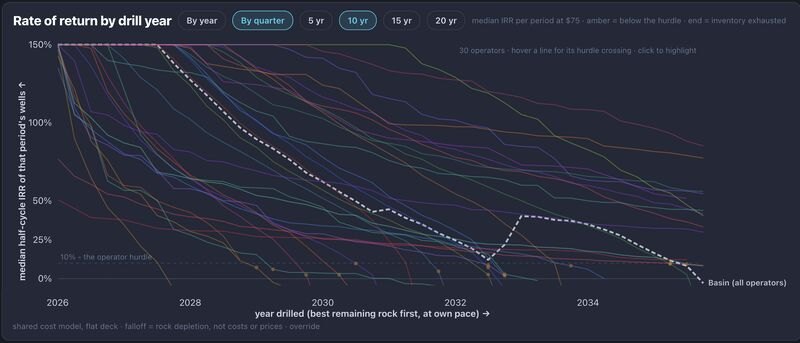
Line chart of median half-cycle IRR by drill year for 30 Delaware operators and the basin

The Delaware Basin median IRR falls to about 10% in 2032, then jumps back to about 40%.

The rock doesn't get better. The runway-constrained operators run out of inventory.

This chart shows 30 Delaware operators, names removed. Each line is the median half-cycle IRR of the wells an operator would drill each quarter over the next decade, at flat $75 oil, one shared cost model, and each operator drilling its best remaining rock first at its own pace. Because costs and prices never change, every decline you see is rock depletion.

The dashed line is the whole basin. Its rebound is survivorship. Operators with thin inventory either fall below a 10% hurdle or exhaust their locations, and the median shifts to the few companies that still have deep, high-quality rock.

For many portfolios, the "10-year runway" is really a 3 to 5 year runway followed by a cliff.

More on LinkedIn
DelawareInventoryEconomics
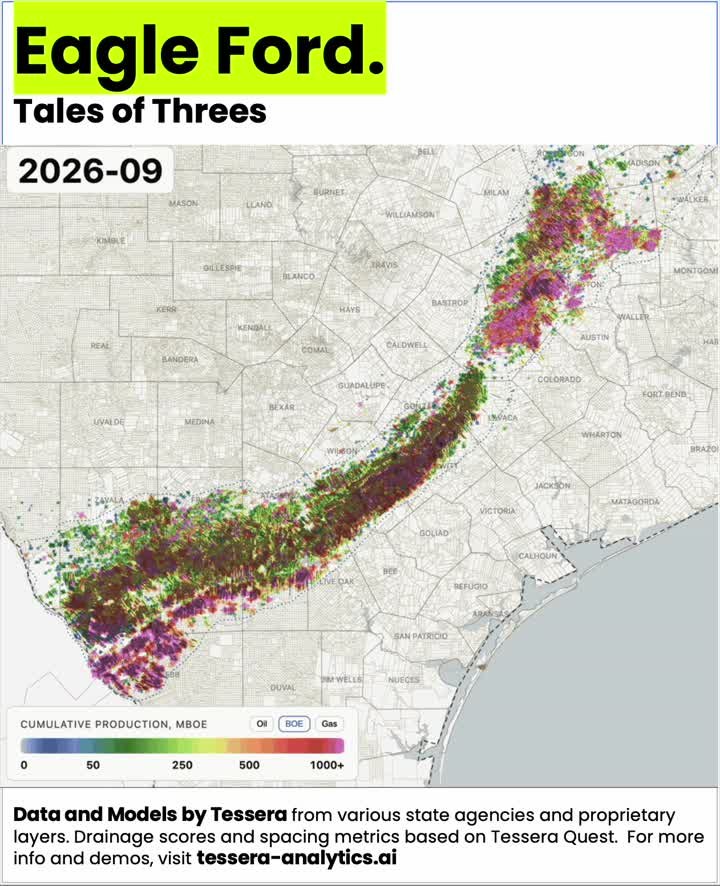
Eagle Ford horizontal wells colored by cumulative production

Eagle Ford. Tales of threes.

Ten years of completion evolution. So where did all that progress go?

A well completed in 2014 produced about 13 Mbbl of oil per 1,000 ft in its first year. A well completed in 2024, with a lateral 60% longer and twice the sand, produced about 13 Mbbl per 1,000 ft. To answer where the progress went, you have to count to three.

Three benches: Austin Chalk above, Eagle Ford in the middle, Buda below. Three windows: oil, condensate, gas. And three development situations the basin increasingly sorts into: isolated 26%, infill 54%, co-developed 20%.

The longer laterals, bigger completions and better designs did work. But increasingly, those improvements were being deployed into rock where another well had already changed the pressure, drainage and remaining resource. The next Eagle Ford opportunity probably isn't hidden on a map of where people haven't drilled. It's hidden in what the existing wells haven't drained.

More on LinkedIn
Eagle FordSpacingCompletions
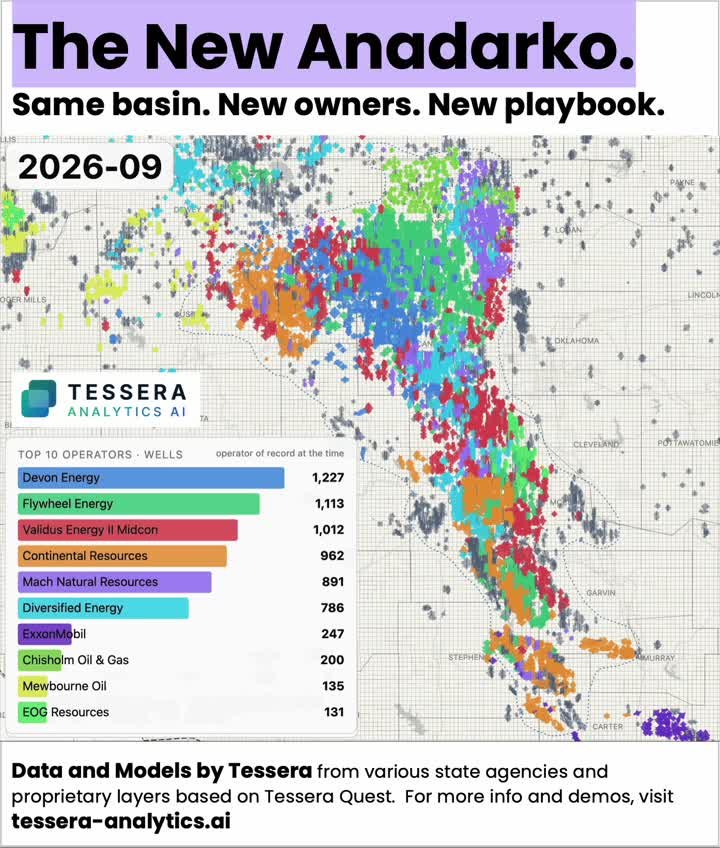
Anadarko Basin wells colored by current operator with a top operators bar chart

The New Anadarko. Same basin. New owners. New playbook.

The Anadarko is quietly becoming a different basin. Not geologically. Ownership-wise.

We're updating our Anadarko data and models, and this caught our attention. New names are now sitting at the table with operators that have been synonymous with the basin for years. And neither footprint was developed by one company or under one philosophy.

Different operators. Different vintages. Different completion designs. Different spacing philosophies. Different geology. Now put all of that under one operator name. If you simply benchmark one operator against another, you're probably looking at the wrong question.

What we really want to know: which pieces of that inherited development actually worked? Which completion designs survived normalization for geology? Where did tighter spacing create value, and where did it just create more wells?

More on LinkedIn
AnadarkoOperators
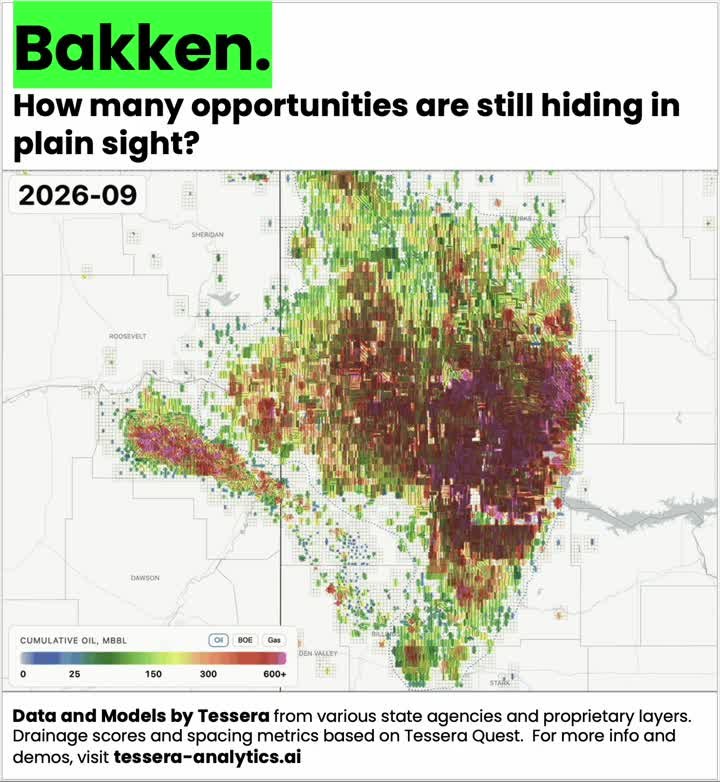
Bakken horizontal wells colored by cumulative oil

Bakken. How many opportunities are still hiding in plain sight?

The Bakken has spent almost 20 years getting better at drilling new wells. The next chapter may be about the wells already there.

Thousands of wells were drilled before today's completion designs, spacing strategies and understanding of parent-child interactions. Some are simply depleted. Some were landed in poorer geoquality. Some were impacted by offset development. And some may have just left a lot behind.

We approach this by asking a different question: what should this well or section have produced given its geology, landing zone, spacing and surrounding development? Then compare that with what it actually produced.

There is still a lot of oil down there. The question is which existing wellbore or pad gets you back to it.

More on LinkedIn
BakkenRefracsRecovery
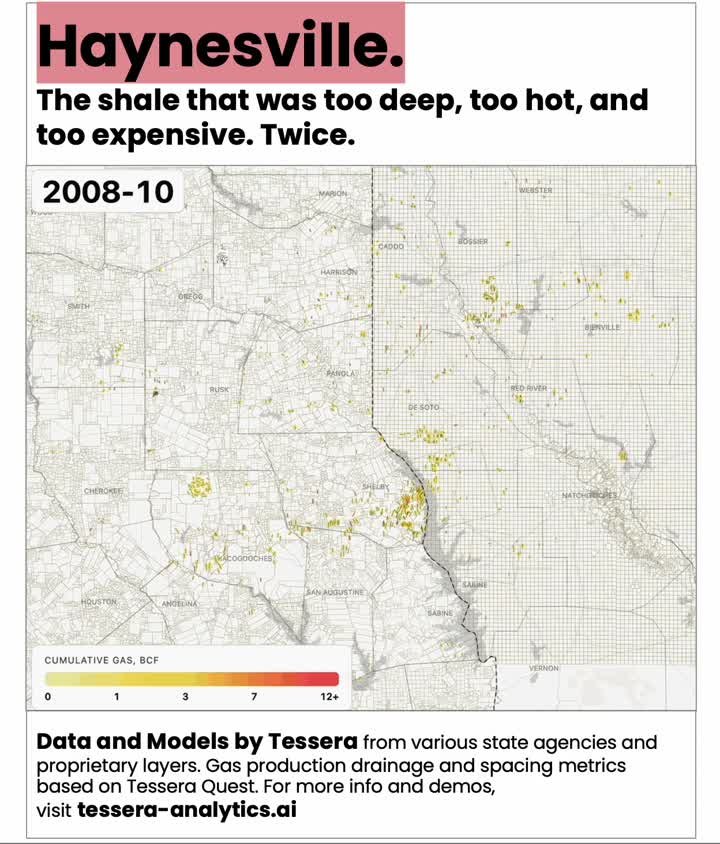
Haynesville time-lapse map of cumulative gas by well

Haynesville. The shale that was too deep, too hot, and too expensive. Twice.

In 2011, the Haynesville drilled 1,097 horizontal wells. In 2016 it drilled 174. Then it came back.

The Haynesville was the hottest thing in gas in 2010 and 2011. Then $2 gas, 12,000 ft TVD wells and 300 F bottom-hole temperatures nearly killed it.

What brought it back was not price alone, it was a different well design. The median lateral went from 4,428 ft in 2011 to 10,159 ft in 2026, and proppant per foot from about 1,200 lb in 2013 to 3,650 lb since 2023, the highest of any basin we track. Median first-12-month gas went from 1.24 Bcf in 2011 to 4.0 Bcf in 2020. Then it slipped.

The question isn't whether the Haynesville still has gas. It's where the next economic well comes from.

More on LinkedIn
HaynesvilleGasCompletions
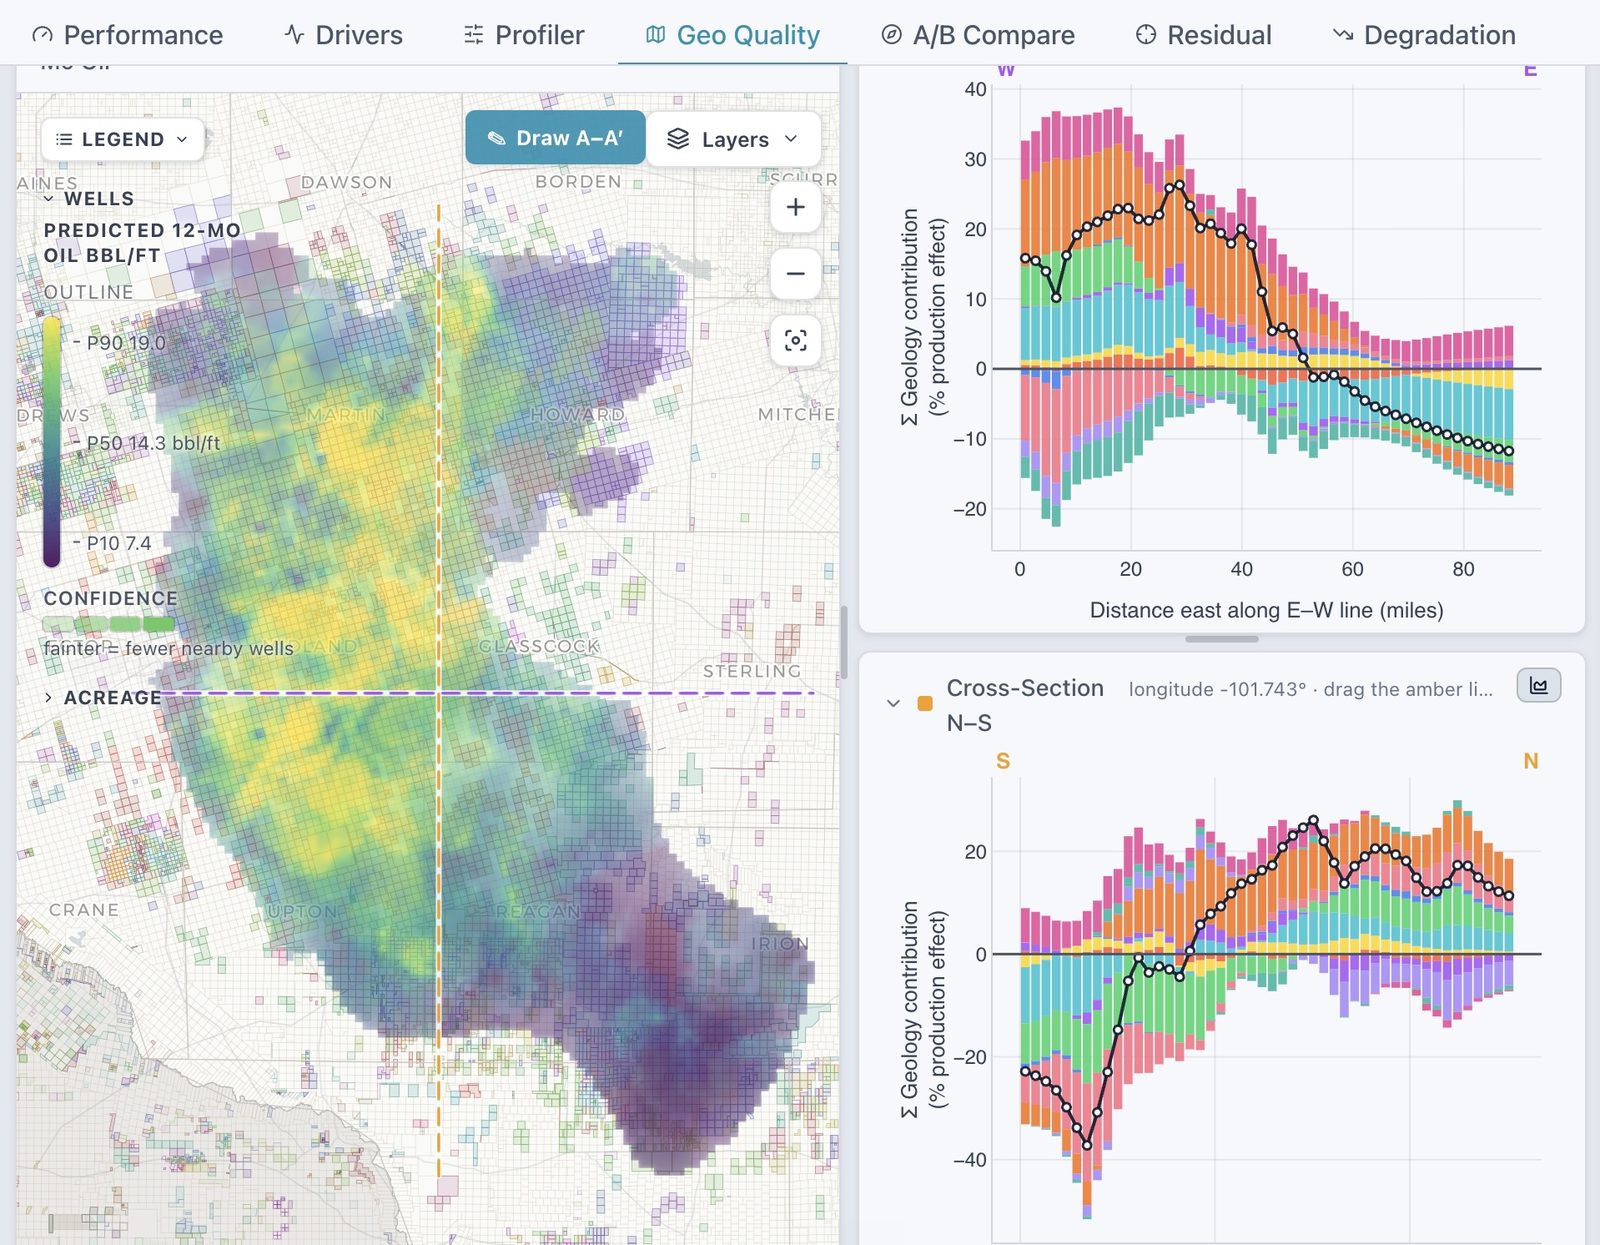
Geo Quality map of predicted oil per foot across the Midland Basin with east-west and north-south cross sections of geology contribution

Where the rock helps and where it hurts.

A predicted oil-per-foot surface for the Midland Basin, with cross sections of how much geology contributes along any line you draw.

The Geo Quality view maps predicted 12-month oil per lateral foot across the Midland Basin, from P10 7.4 to P90 19.0 bbl/ft, and fades where fewer wells support the estimate. Draw an east-west or north-south line and the panel beside it stacks the geology contribution to production along that line, attribute by attribute.

Going west to east across Martin and Howard the geology effect swings from plus 25 percent to minus 10 percent in under 90 miles. That is the kind of number an acreage conversation needs before anyone talks about completion design.

More on LinkedIn
MidlandGeologyAI Engine
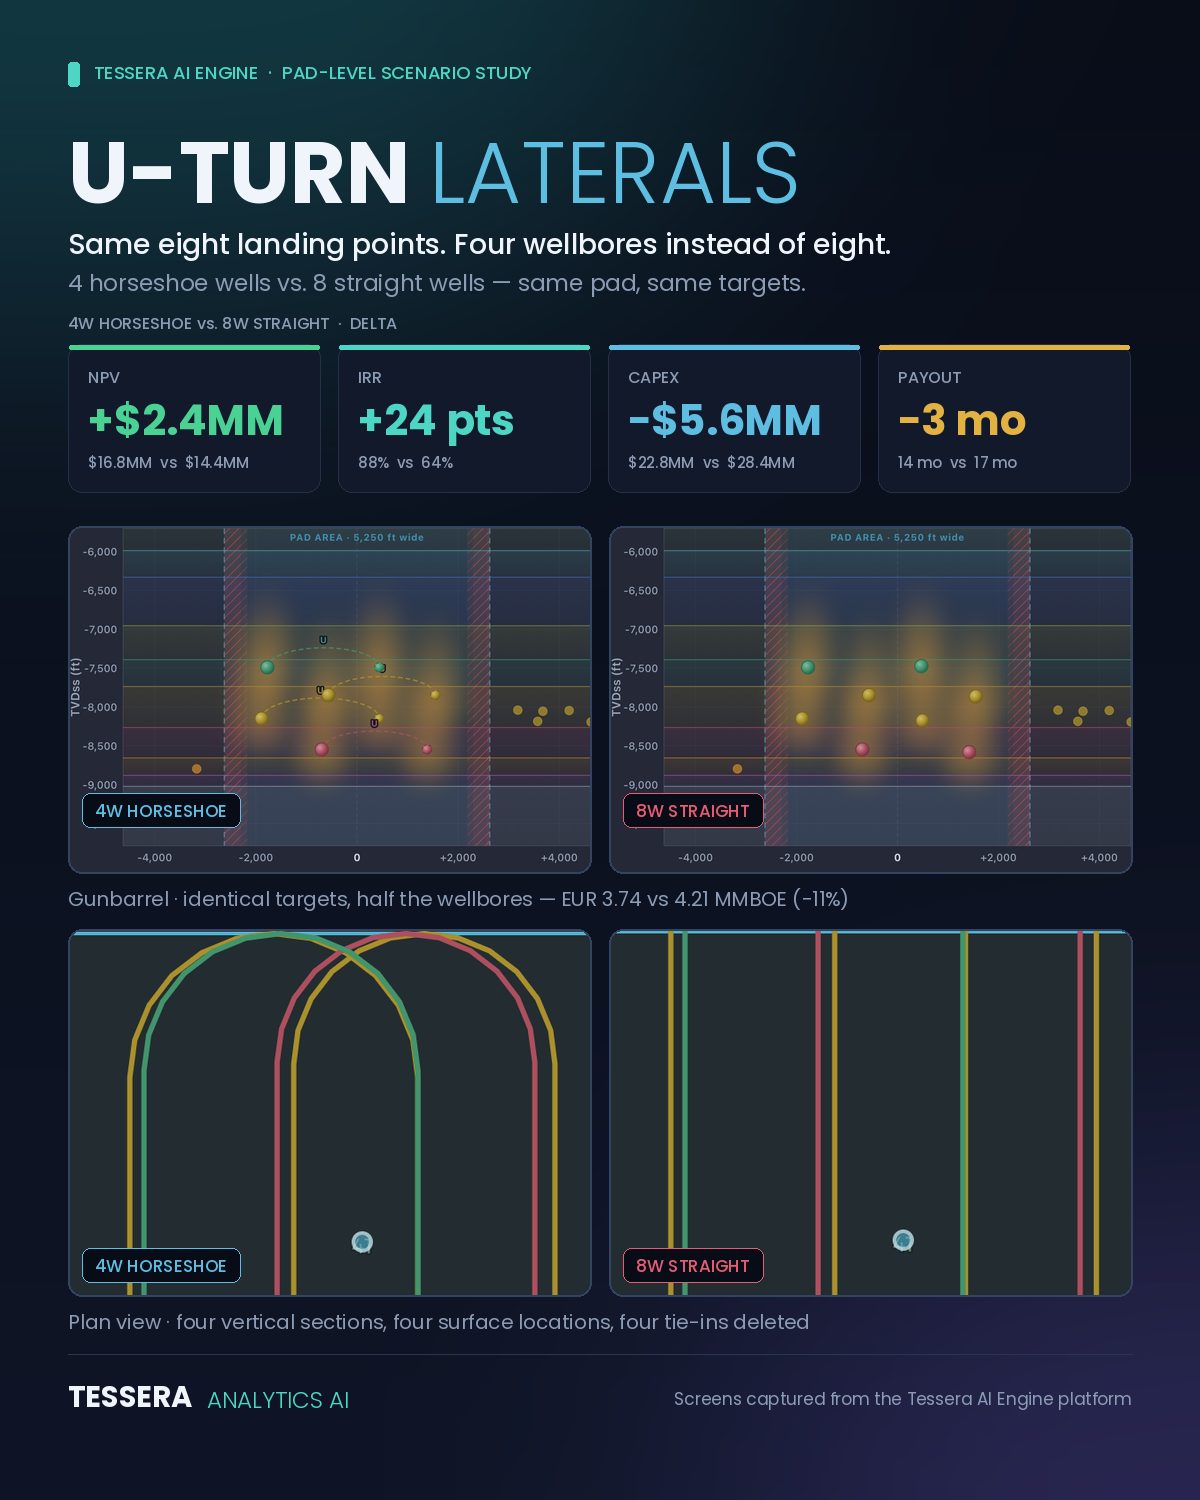
U-turn laterals scenario: four horseshoe wells versus eight straight wells with NPV, IRR, capex and payout deltas

U-turn laterals: same eight targets, four wellbores.

A pad-level scenario in the AI Engine comparing four horseshoe wells with eight straight wells on identical landing points.

Four horseshoe wells reach the same eight landing points as eight straight wells, on the same pad. Running both designs through the AI Engine gives the horseshoe pad 2.4 million dollars more NPV, 24 points more IRR, 5.6 million dollars less capital and payout three months sooner.

The trade is EUR: 3.74 versus 4.21 MMBOE, about 11 percent less, because every U-turn gives up some reach. Whether that trade is worth it depends on the lease shape and the cost of the four vertical sections you no longer drill, and the scenario makes both halves of that decision visible.

More on LinkedIn
Pad designEconomicsAI Engine
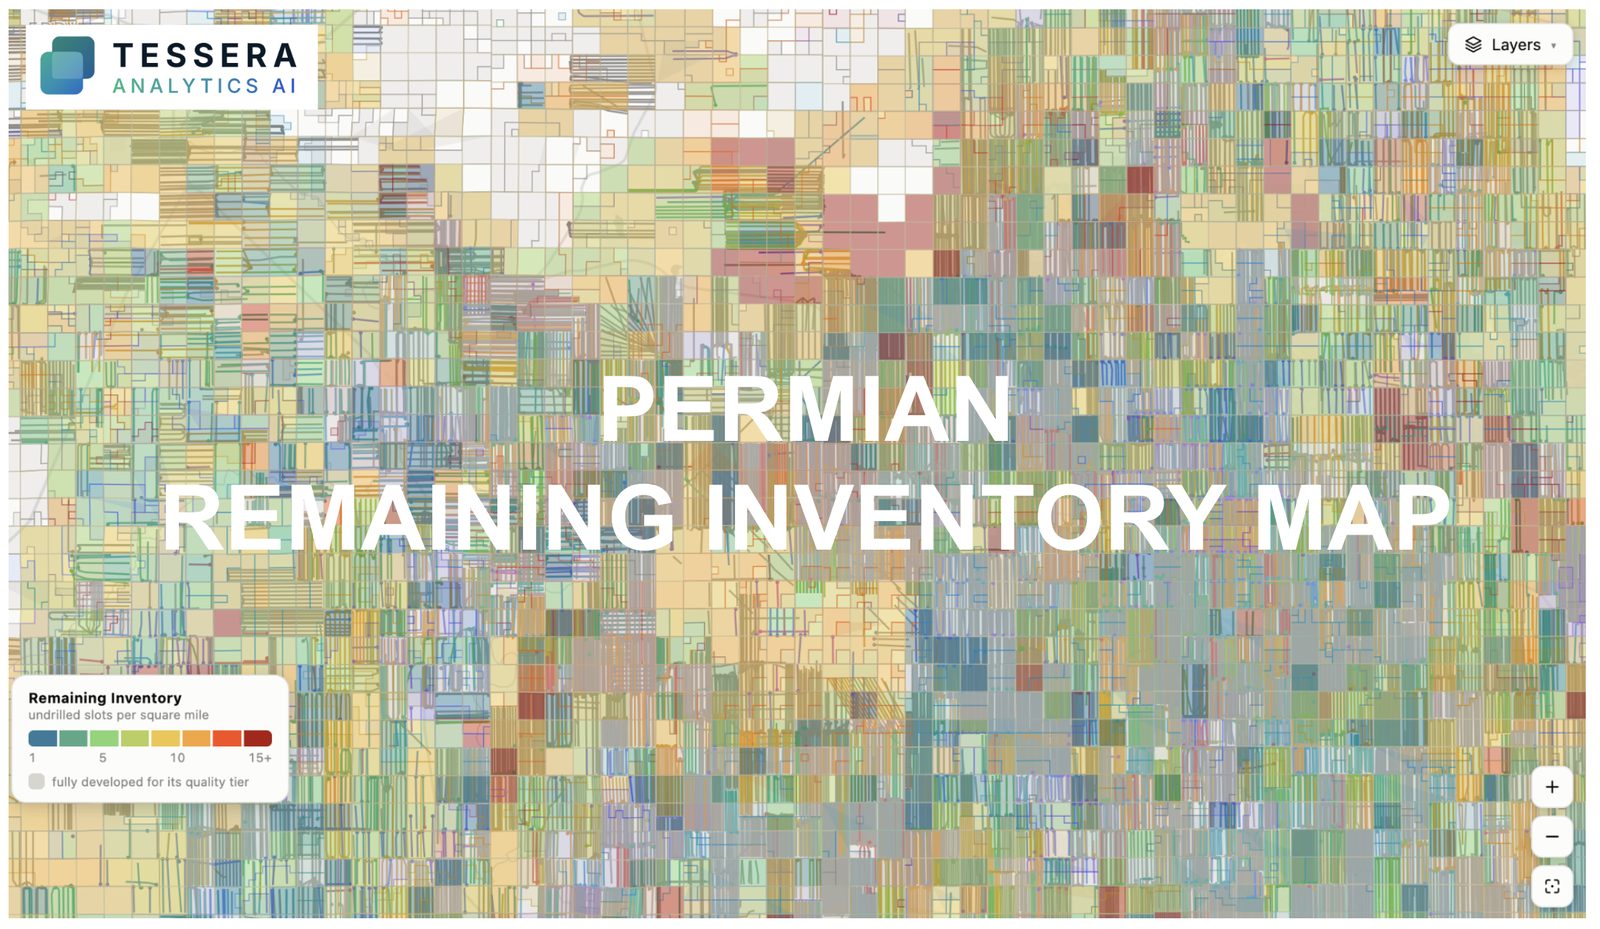
Permian remaining inventory map colored by undrilled slots per square mile

The Permian remaining inventory map.

Undrilled slots per square mile, section by section, with fully developed sections greyed out for their quality tier.

Every section in the Permian, colored by how many undrilled locations are left once the developed laterals, the spacing assumption and the zone extents are accounted for. Grey sections are fully developed for their quality tier. The map is built from the laterals themselves, not from an operator slide.

Inventory is a function of the density decision, so the map changes when the spacing assumption does. That sensitivity is the point: it shows where the remaining locations are robust and where they only exist on paper.

More on LinkedIn
PermianInventory
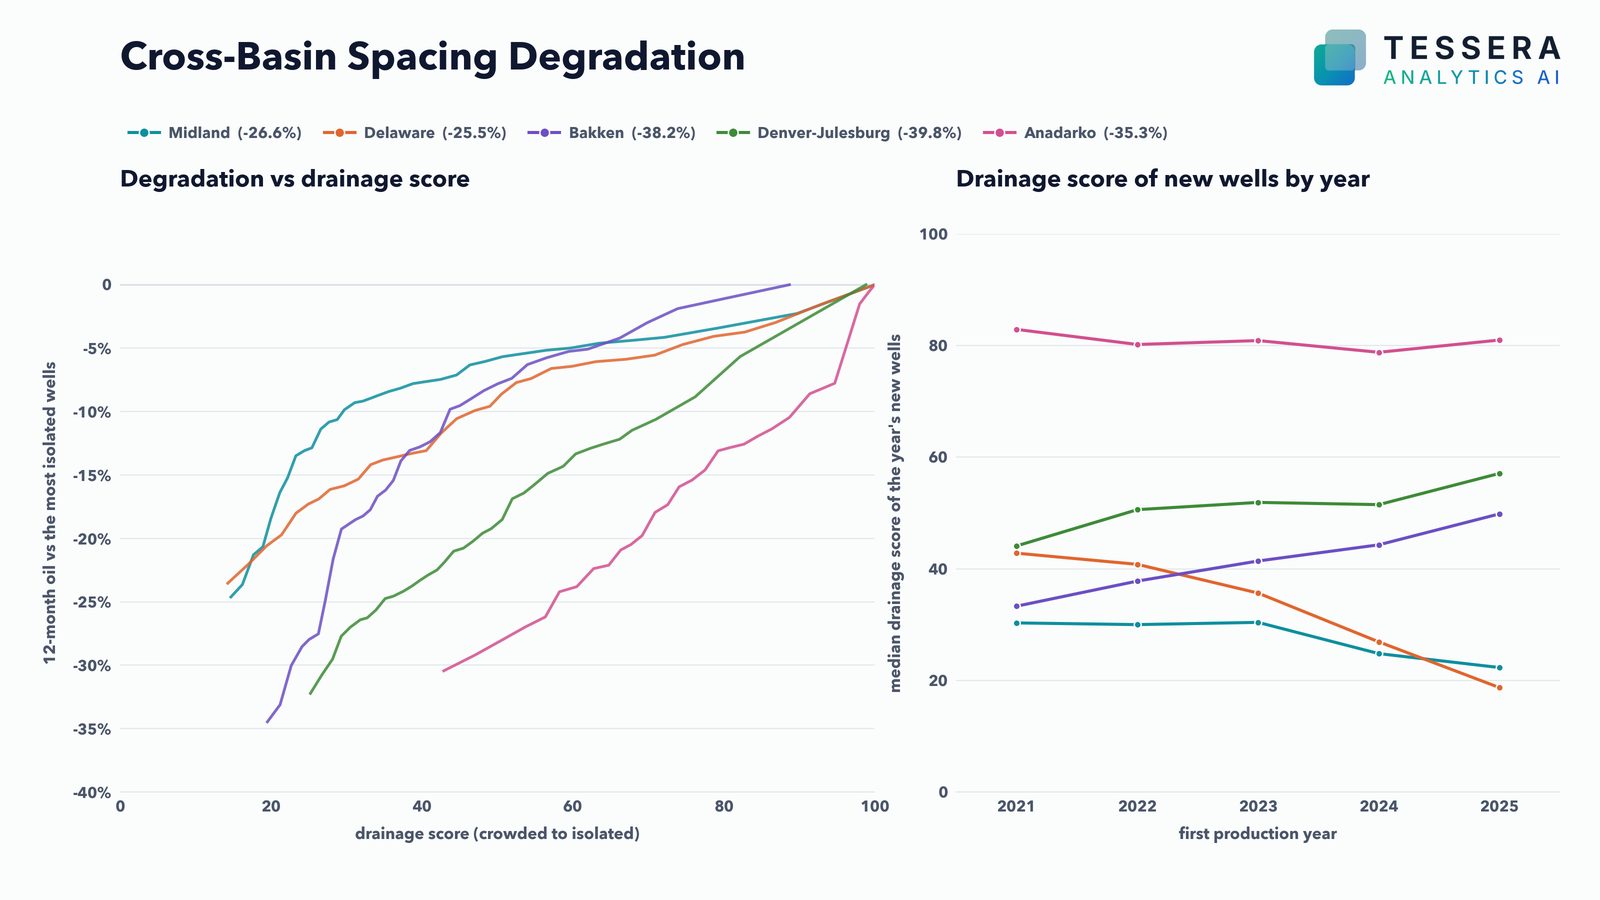
Cross-basin spacing degradation: 12-month oil loss versus drainage score for five basins, and drainage score of new wells by year

Spacing degradation, basin by basin.

How much 12-month oil a crowded well gives up against the most isolated wells in its basin, and which direction new wells are heading.

Measured against the most isolated wells in each basin, the most crowded wells give up 26.6 percent of 12-month oil in the Midland, 25.5 percent in the Delaware, 38.2 percent in the Bakken, 39.8 percent in the Denver-Julesburg and 35.3 percent in the Anadarko. The curves differ in shape as well as depth, which matters for where the next well goes.

The second panel tracks the median drainage score of each year's new wells. Permian wells have been getting more crowded since 2023 while Bakken and DJ wells have been getting more isolated, so the degradation curves are being walked in opposite directions.

More on LinkedIn
SpacingMulti-basin
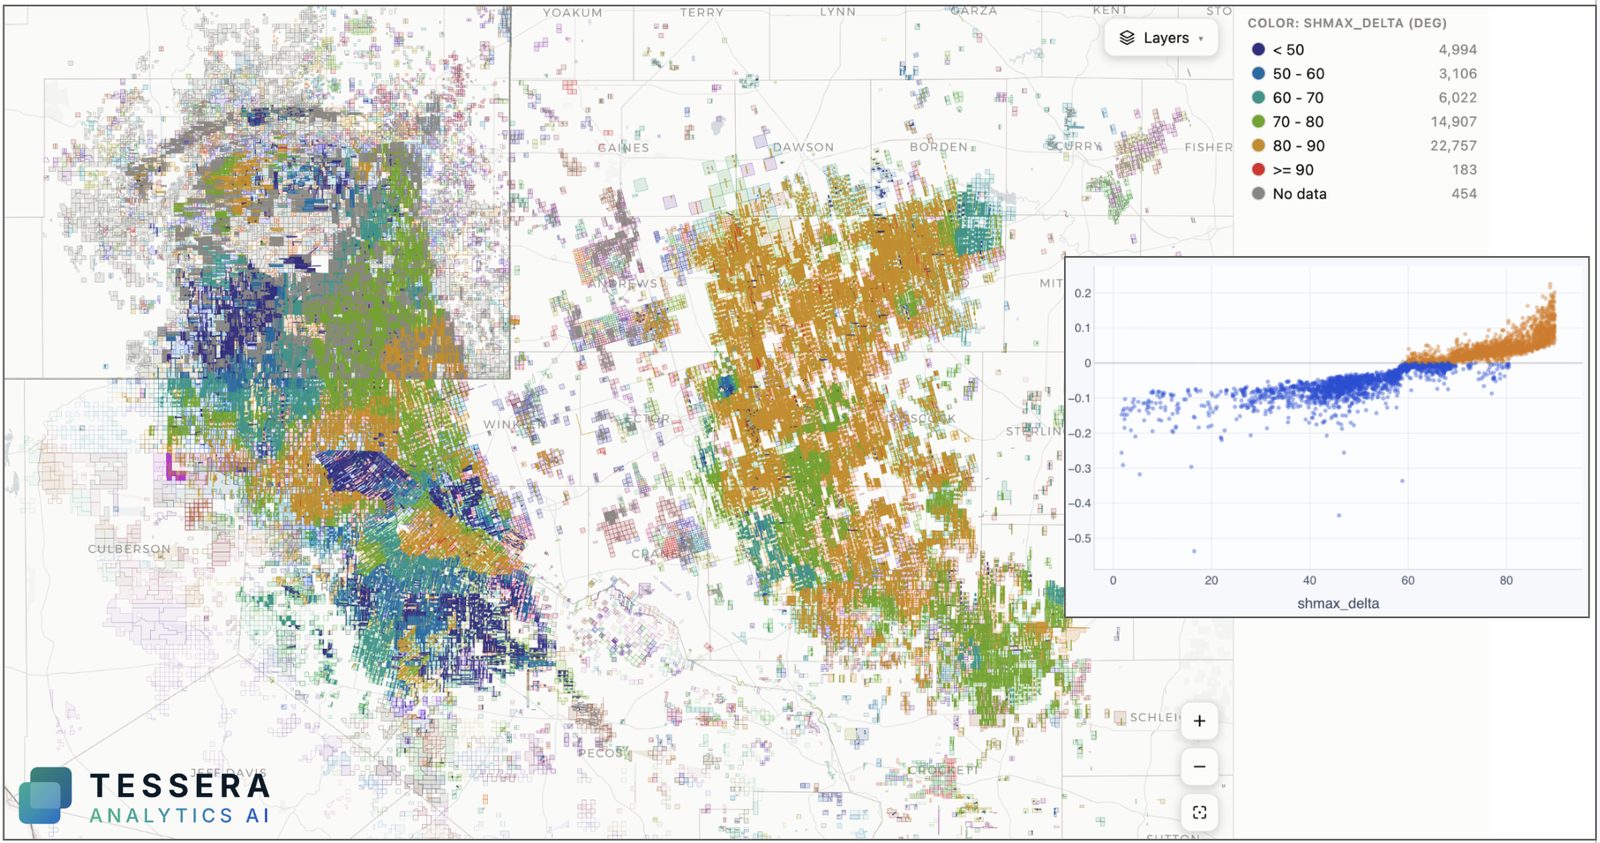
Permian laterals colored by angle to maximum horizontal stress with a residual-versus-angle scatter

Lateral azimuth against maximum horizontal stress.

Every Permian horizontal colored by how far its lateral sits from the maximum horizontal stress direction, and what that does to performance.

Each lateral is colored by the angle between its azimuth and the local maximum horizontal stress. Most Midland wells sit in the 80 to 90 degree band; the Delaware is far more mixed, with thousands of wells drilled within 60 degrees of SHmax.

The inset plots the performance residual against that angle. The relationship is flat until roughly 60 degrees and then climbs steeply, which is the behavior you would expect from transverse fractures and a useful check on any acreage where the azimuth was set by the lease line.

More on LinkedIn
PermianGeomechanics
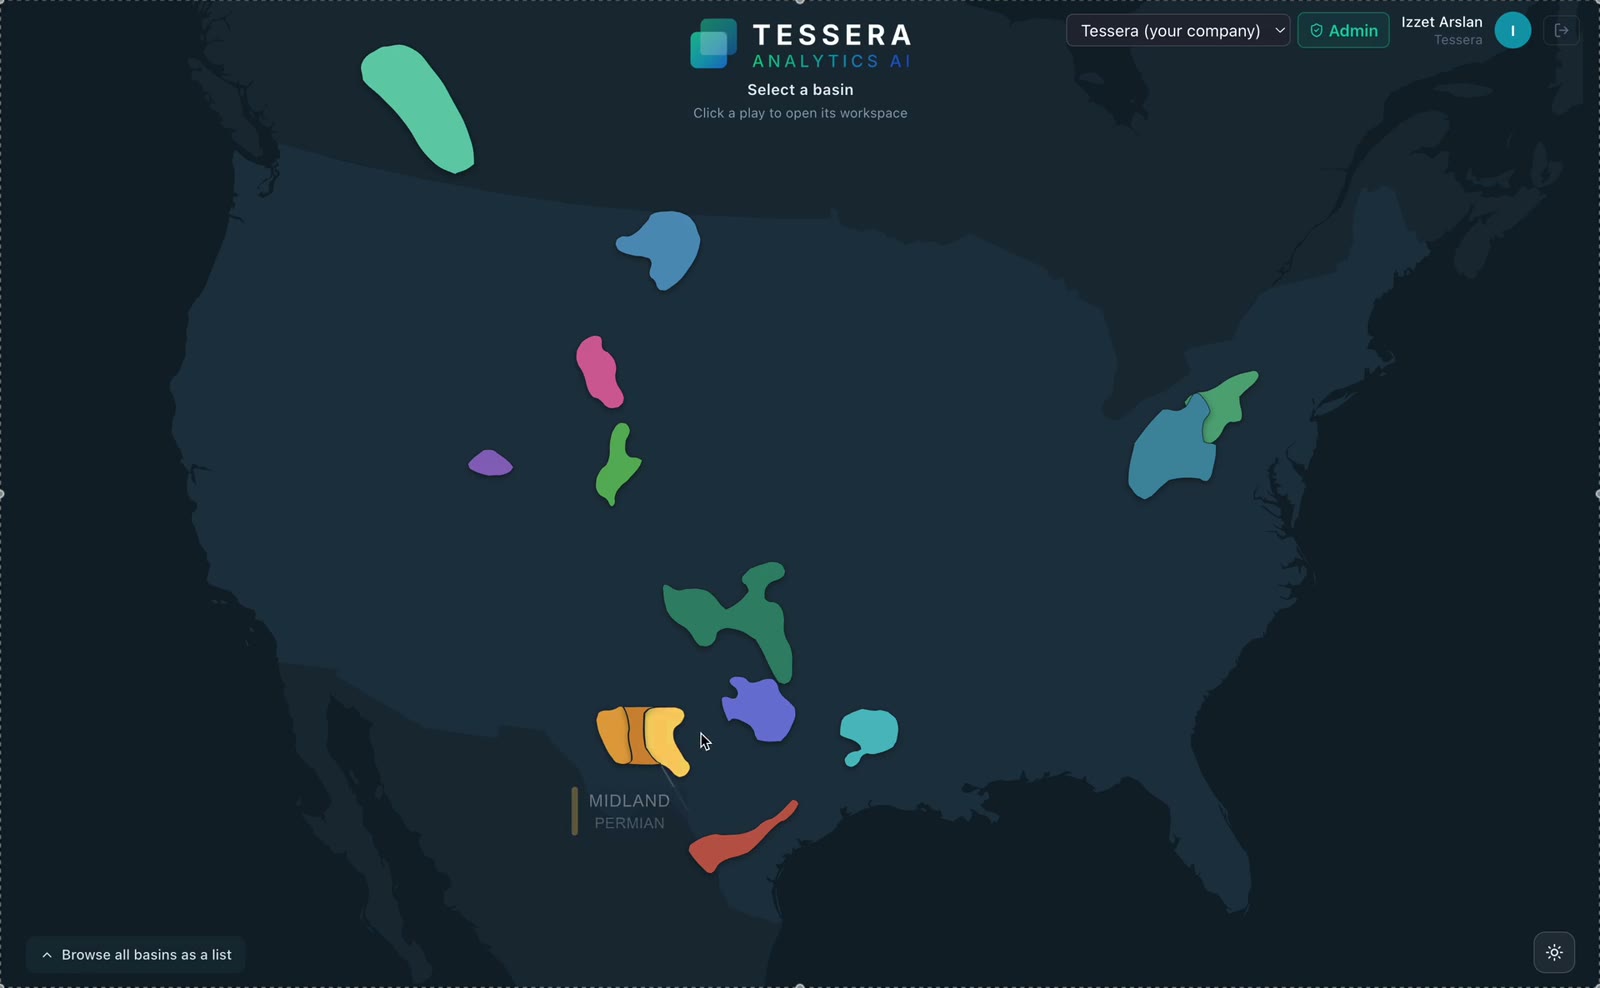
Tessera basin picker: North American unconventional basins on a map with the Midland Basin highlighted

Pick a basin. Same workflow in every one.

The AI Engine opens on a map of North American basins. Click one and the wells, laterals, attributes and models are already there.
The short video starts on the basin picker, opens a Delaware project and colors 42,546 wells by thermal maturity in a few clicks. Pressure gradient, reservoir temperature, organic content and every other attribute sit in the same dropdown, already joined to the laterals.

The same allocated production, surveyed laterals, standardized landing zones and spacing measurements sit under every basin, so a type curve in the Uinta is built the same way as one in the Delaware, and an analog search does not stop at a basin boundary.

More on LinkedIn
Multi-basinData
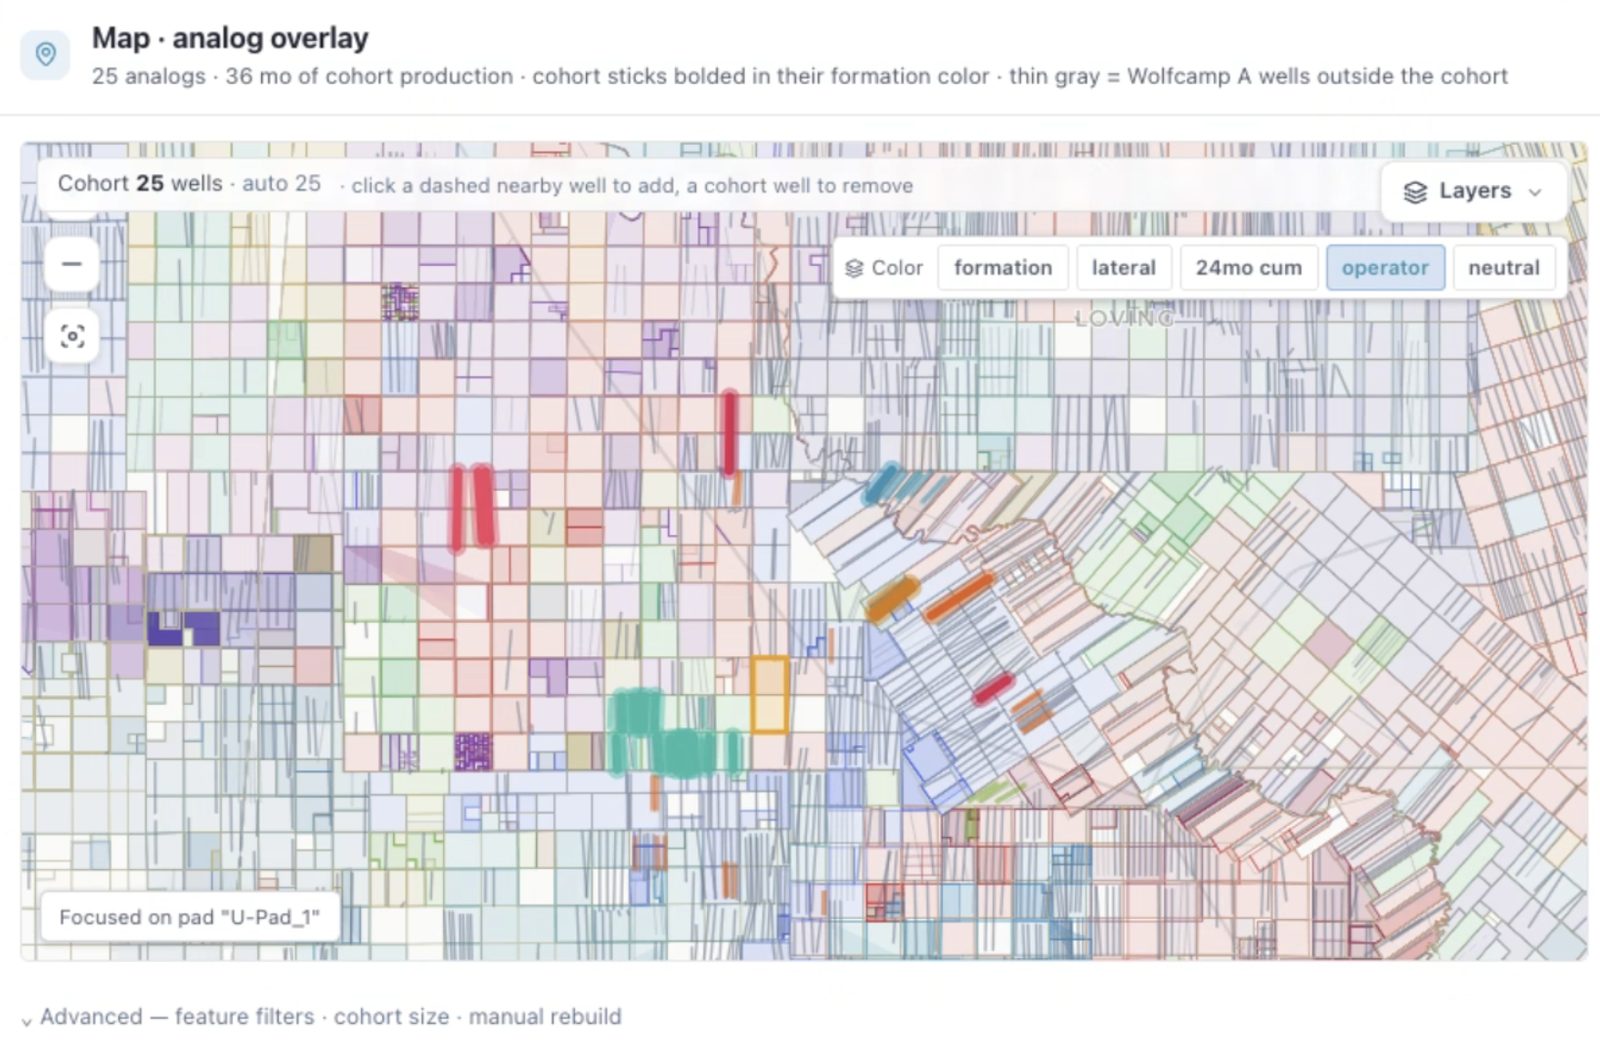
Map with 25 analog wells highlighted in their formation colors around a planned pad in Loving County

Twenty-five analogs, picked by the data.

The analog overlay selects a cohort of offset wells for a planned pad and shows them on the map in their formation colors.

For a planned pad in Loving County the engine selected 25 Wolfcamp A analogs with 36 months of cohort production, bolded them on the map in their operator or formation color and left every other Wolfcamp A well in thin grey. Click a dashed neighbor to add it, click a cohort well to remove it, and the type curve rebuilds.

Analog selection is usually the least documented step in a forecast. Putting it on a map, with the feature filters and cohort size exposed, makes it something a reviewer can argue with.

More on LinkedIn
DelawareForecastingAI Engine
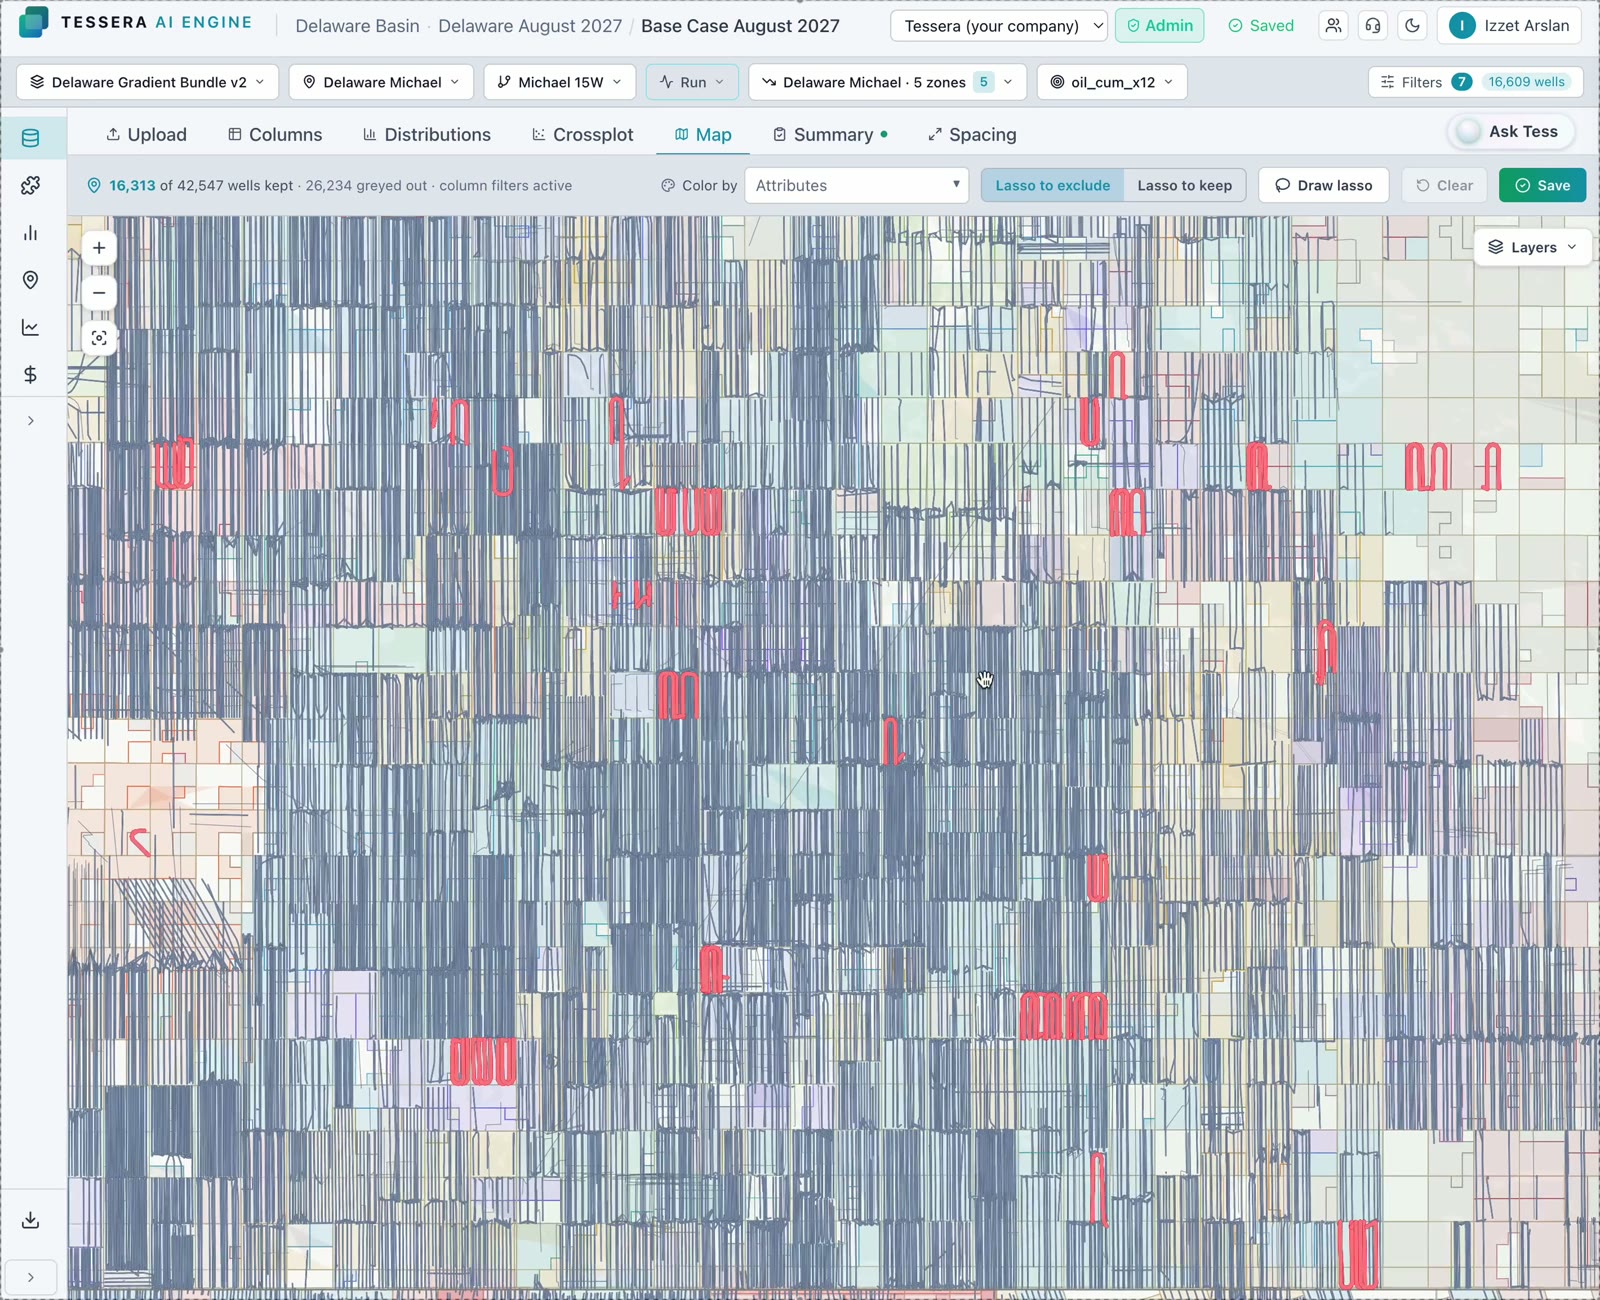
Delaware Basin lateral map with U-shaped laterals highlighted in red

Finding every U-lateral in the Delaware.

Horseshoe wells are easy to miss in a header table and impossible to miss on a lateral map.

Among 42,547 Delaware wells the survey-based laterals pick out the horseshoe wells immediately, highlighted in red against the straight laterals around them. Filtering by column attributes and lasso narrows the set to the 16,313 wells that matter for the comparison.

The short video shows the map doing the work. U-laterals are now common enough that a spacing or inventory study that treats them as straight sticks is wrong on both counts.

More on LinkedIn
DelawareWell geometry
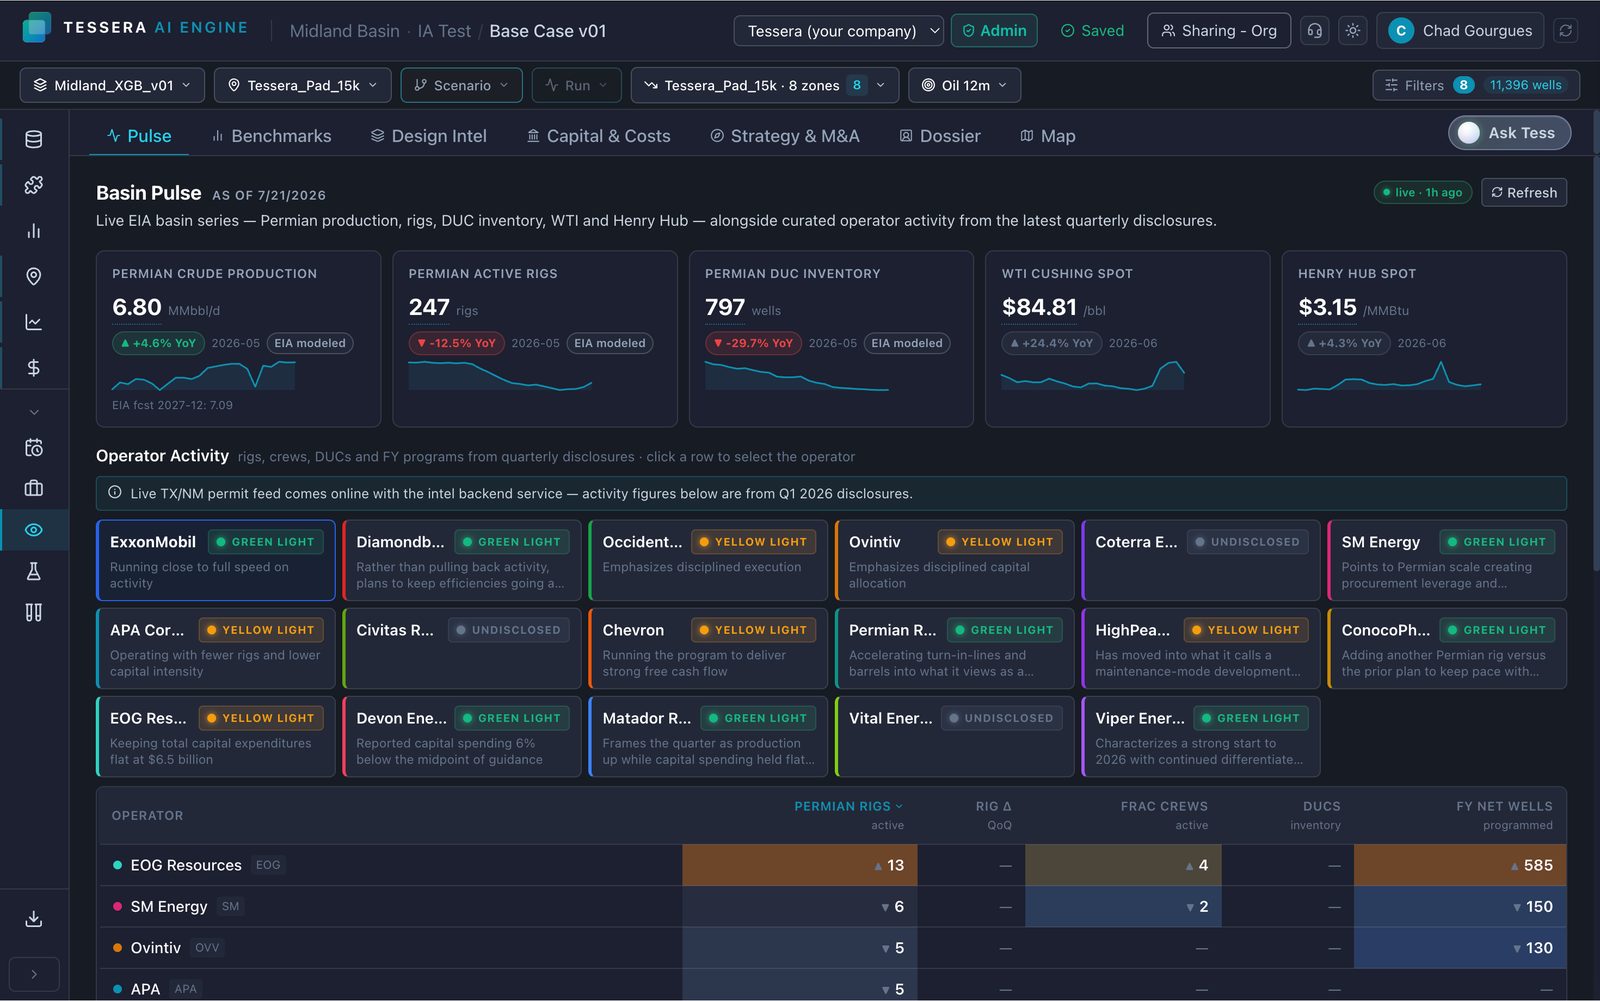
Basin Pulse screen with Permian production, rigs, DUC inventory, WTI and Henry Hub tiles and operator activity cards

Data, models, insights, design, economics, decision.

One platform, six steps, the same wells underneath each of them. Plus a basin pulse that updates while you work.

The platform walk-through follows a single case from the data, through model training and driver ranking, insights, pad design and forecast economics, to a decision. Each step reads from the same dataset, so nothing is re-exported, re-joined or re-explained on the way.

The Basin Pulse screen adds the market layer: Permian production, rigs, DUC inventory, WTI and Henry Hub from live EIA series, next to curated operator activity from the latest quarterly disclosures, with each operator flagged green, yellow or undisclosed.

More on LinkedIn
PlatformIntelligence
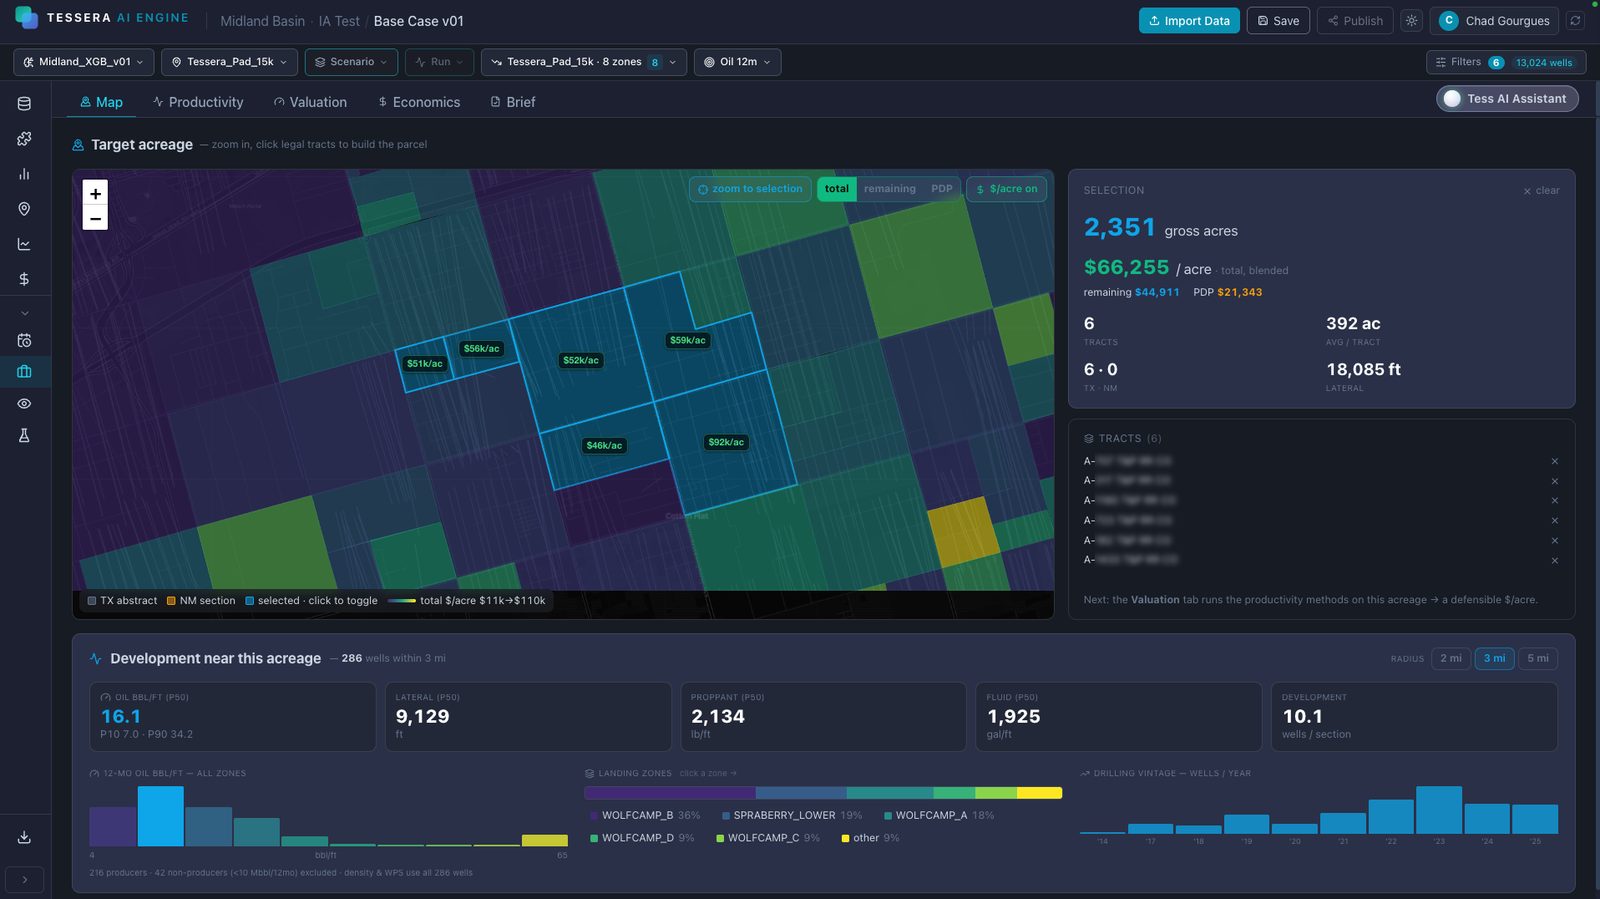
Deal flow screen with selected tracts, blended dollars per acre and development statistics for wells within three miles

A package lands. Price it before lunch.

Click the legal tracts, and the engine returns a blended dollars-per-acre with the remaining and PDP split and the development around it.

Select six tracts in the Midland Basin and the deal flow screen returns 2,351 gross acres at a blended 66,255 dollars per acre, split between remaining locations and PDP, with lateral footage, the Texas and New Mexico mix and a per-tract value on the map.

Below it, the 286 wells within three miles summarize the neighborhood: median oil per foot, lateral length, proppant and fluid loading, landing zone mix and drilling vintage. The Valuation tab then runs the productivity methods on that acreage to make the number defensible.

More on LinkedIn
A&DEconomicsAI Engine
URTeC 2026 booth announcement, Booth 331, Houston, June 22 to 24

Heading to URTeC 2026, Booth 331.

Three days in Houston showing how data becomes models, models become insights and insights become decisions.

Tessera Analytics is at URTeC 2026 in Houston, June 22 to 24, at Booth 331. We are showing how subsurface intelligence helps operators turn data into models, models into insights, and insights into value-maximized decisions across unconventional development.

Live demos all three days on the Permian, Bakken, Anadarko, Eagle Ford, Uinta and Haynesville. Come and bring a question about your own acreage.

More on LinkedIn
EventsURTeC
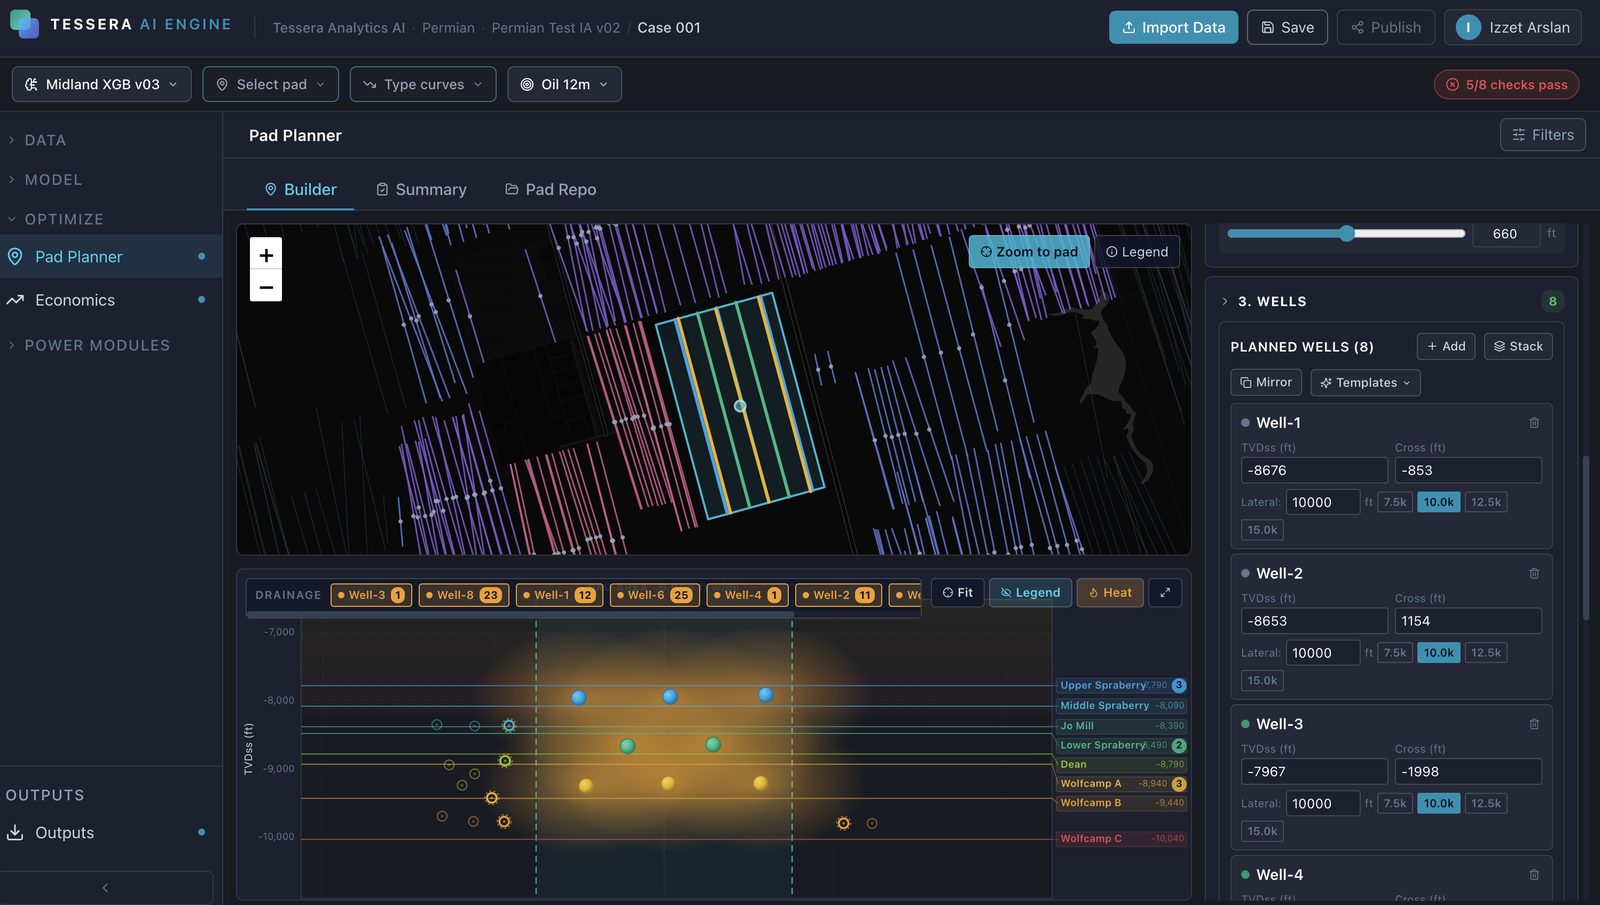
Pad Planner with eight planned wells on the map and a cross section of drainage across Spraberry and Wolfcamp benches

Plan the pad, see the drainage.

Eight planned wells across the Spraberry and Wolfcamp benches, with the drainage of every neighbor drawn underneath them.

The Pad Planner places planned wells on the map and in a cross section at once. Each well gets a TVD, a cross-offset and a lateral length; the drainage view below shows the planned wells against the existing producers in each bench, from the Upper Spraberry down to Wolfcamp C.

Spacing is a slider. Move it and the drainage halos, the parent-child count per well and the checks at the top of the screen update, so the pad is designed against the wells that are actually there.

More on LinkedIn
Pad designMidlandAI Engine
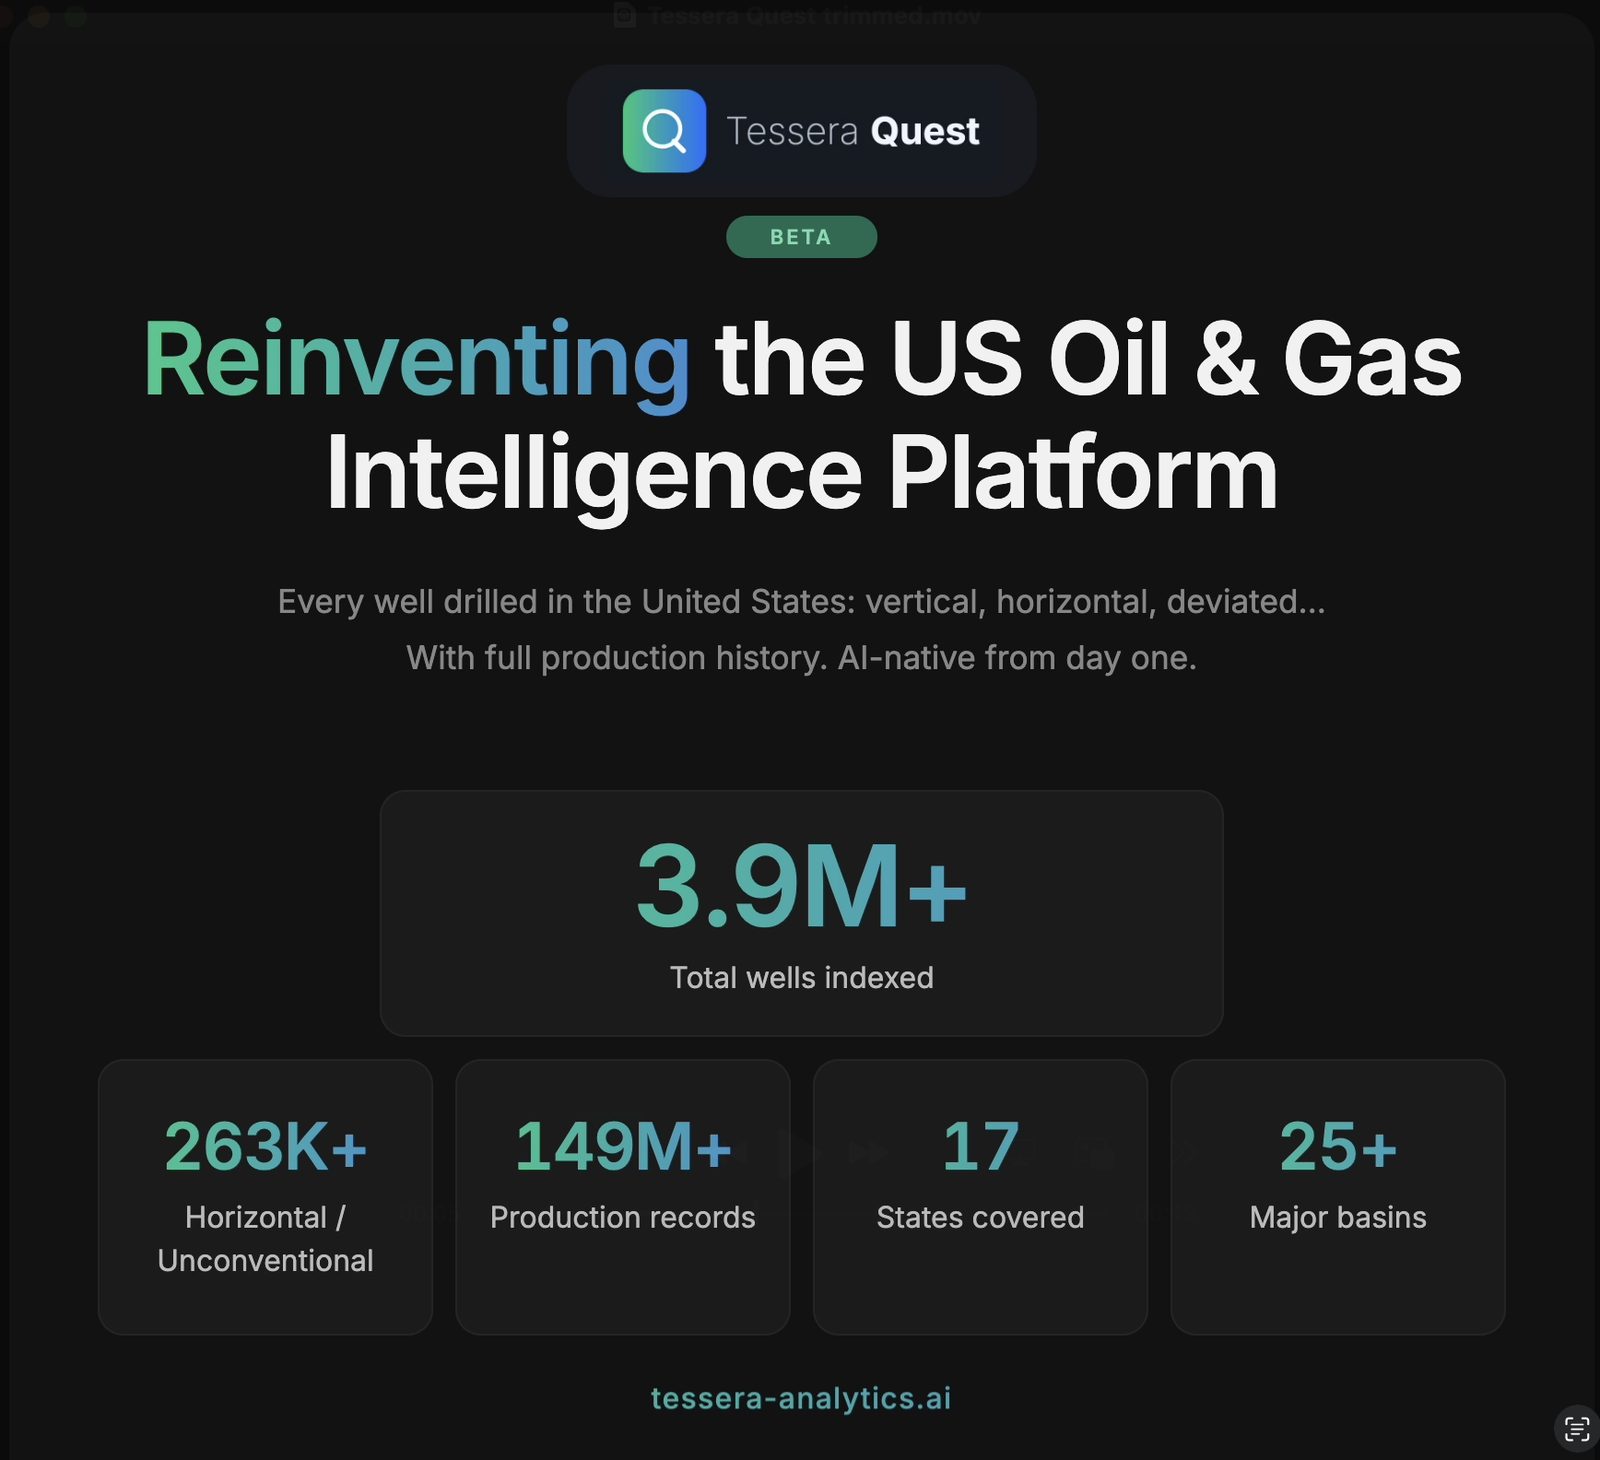
Tessera Quest beta: 3.9 million wells indexed, 263 thousand horizontal, 149 million production records, 17 states, 25 plus basins

Tessera Quest, in beta.

Every well drilled in the United States, with full production history, behind a question box.

Tessera Quest indexes every well drilled in the United States, vertical, horizontal and deviated, with full production history: 3.9 million wells, 263 thousand of them horizontal, 149 million production records, 17 states and more than 25 basins at the time of the beta.

You ask in plain language and Quest answers with the wells, the chart and the number. It reports aggregates only, which is what makes it safe to put in front of a whole team.

More on LinkedIn
Tessera QuestData
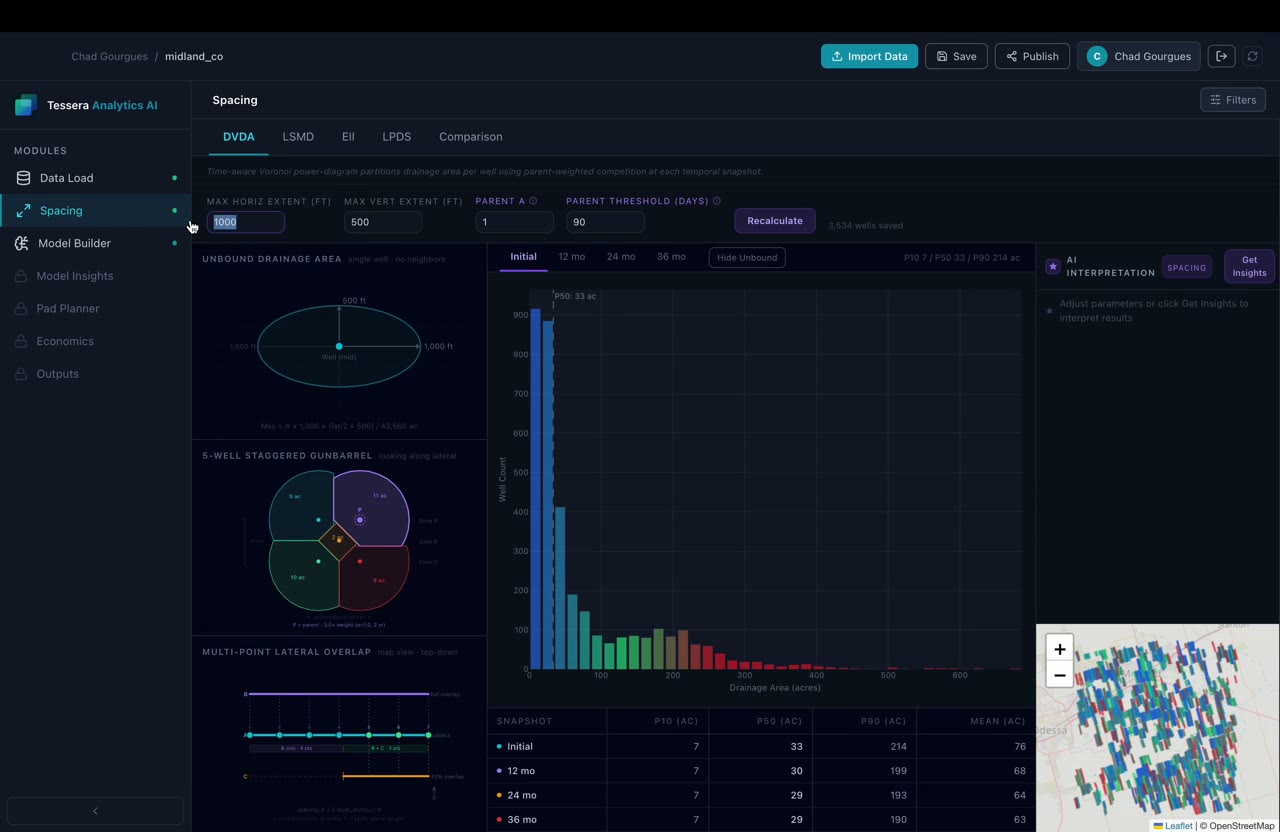
Spacing module with drainage area histogram and the P10, P50 and P90 drainage area at initial, 12, 24 and 36 months

Drainage area, measured over time.

A time-aware Voronoi partition that gives every well its drainage area at first production and again at 12, 24 and 36 months.

The spacing module partitions drainage between wells with a parent-weighted, time-aware Voronoi diagram. For 3,534 Midland wells the P50 drainage area starts at 33 acres and falls to 29 acres by 36 months as neighbors arrive; the P10 stays at 7 acres throughout.

The same screen shows the unbound drainage ellipse, a five-well staggered gunbarrel and the lateral overlap along the wellbore, so the single number has a picture attached to it.

More on LinkedIn
SpacingMidland
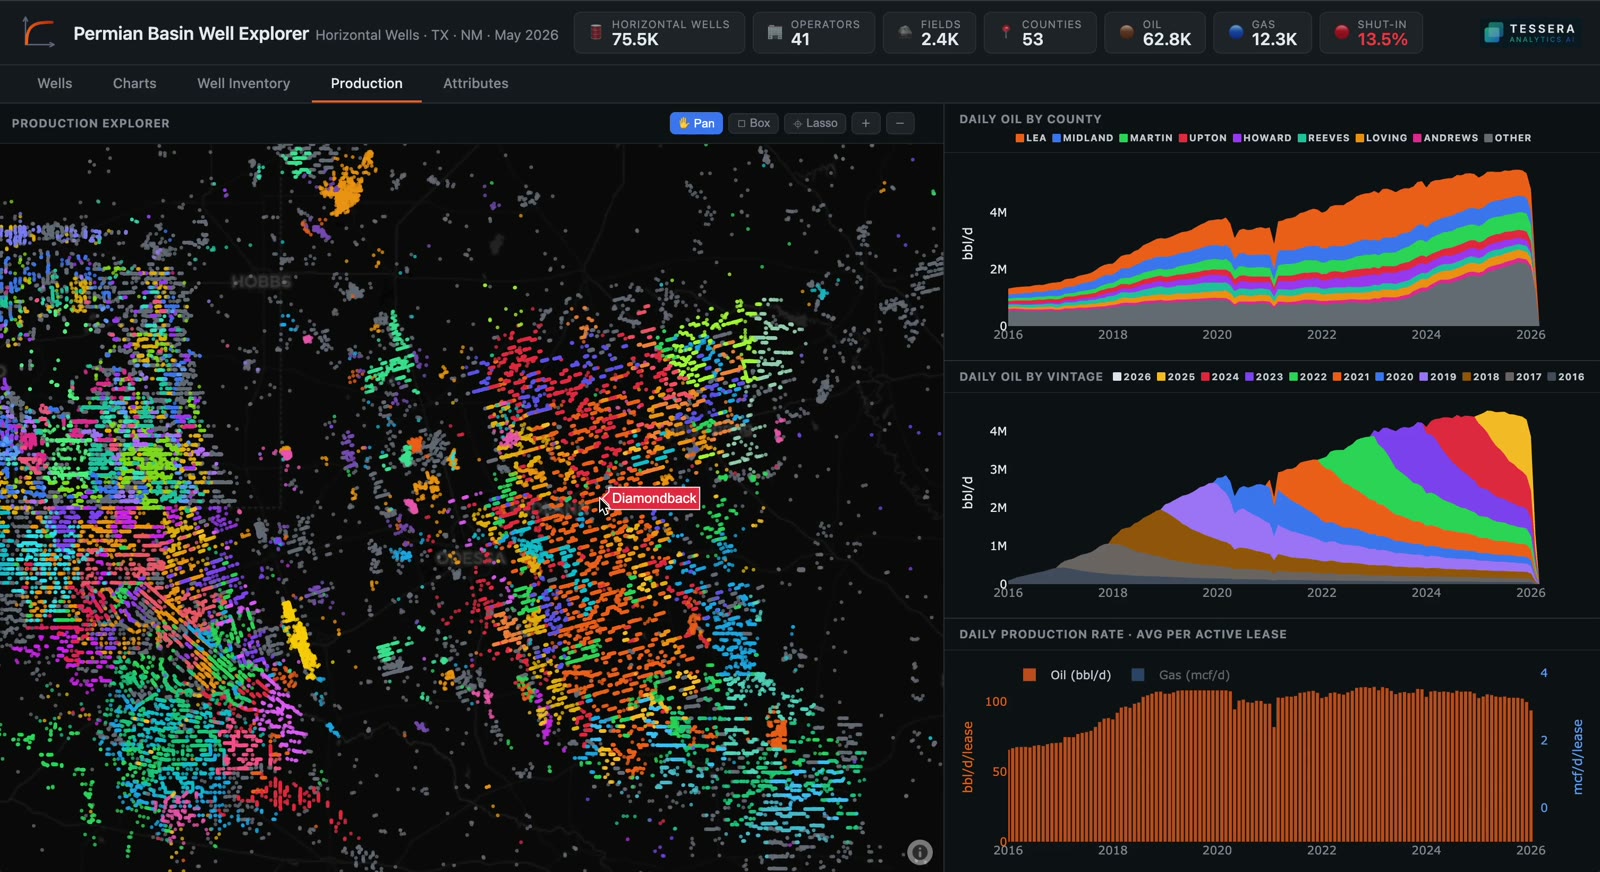
Permian Basin well explorer with horizontal wells colored by operator and daily oil by county and by vintage

Every Permian horizontal, on one screen.

Horizontal wells in Texas and New Mexico, colored by operator, with daily oil by county and by vintage beside the map.

The Permian well explorer puts 75.5 thousand horizontal wells from 41 operators, 2.4 thousand fields and 53 counties on a single map, colored by operator. Beside it, daily oil stacks by county and by first-production vintage, and the average rate per active lease runs underneath.

The vintage chart is the one to watch: each year's wells arrive on top of a base that is declining, and the shape of that stack is the Permian treadmill in one picture.

More on LinkedIn
PermianData

Ask the next question on your own acreage.

Every story above was produced inside the platform. Request a demo and we will run one on the wells you care about.