
Do not just query the data. Understand it.
Part of Tessera QuestNormalize for rock, lateral length and completion intensity, then compare what is left. Tessera turns a pile of wells into cohorts, benchmarks and explanations.
Start from the question.
The machinery stays underneath. You ask; Tessera pulls the wells, runs the numbers and shows the map.
- 01Why are these wells outperforming the offsets?
- 02How does Operator A compare with Operator B after normalizing for rock quality?
- 03Which completion variables actually move recovery in this zone?
- 04What is the parent-child penalty in this township?
This is the product, not a mockup.
Tessera Quest running on Tessera Data. A real screen, real wells.
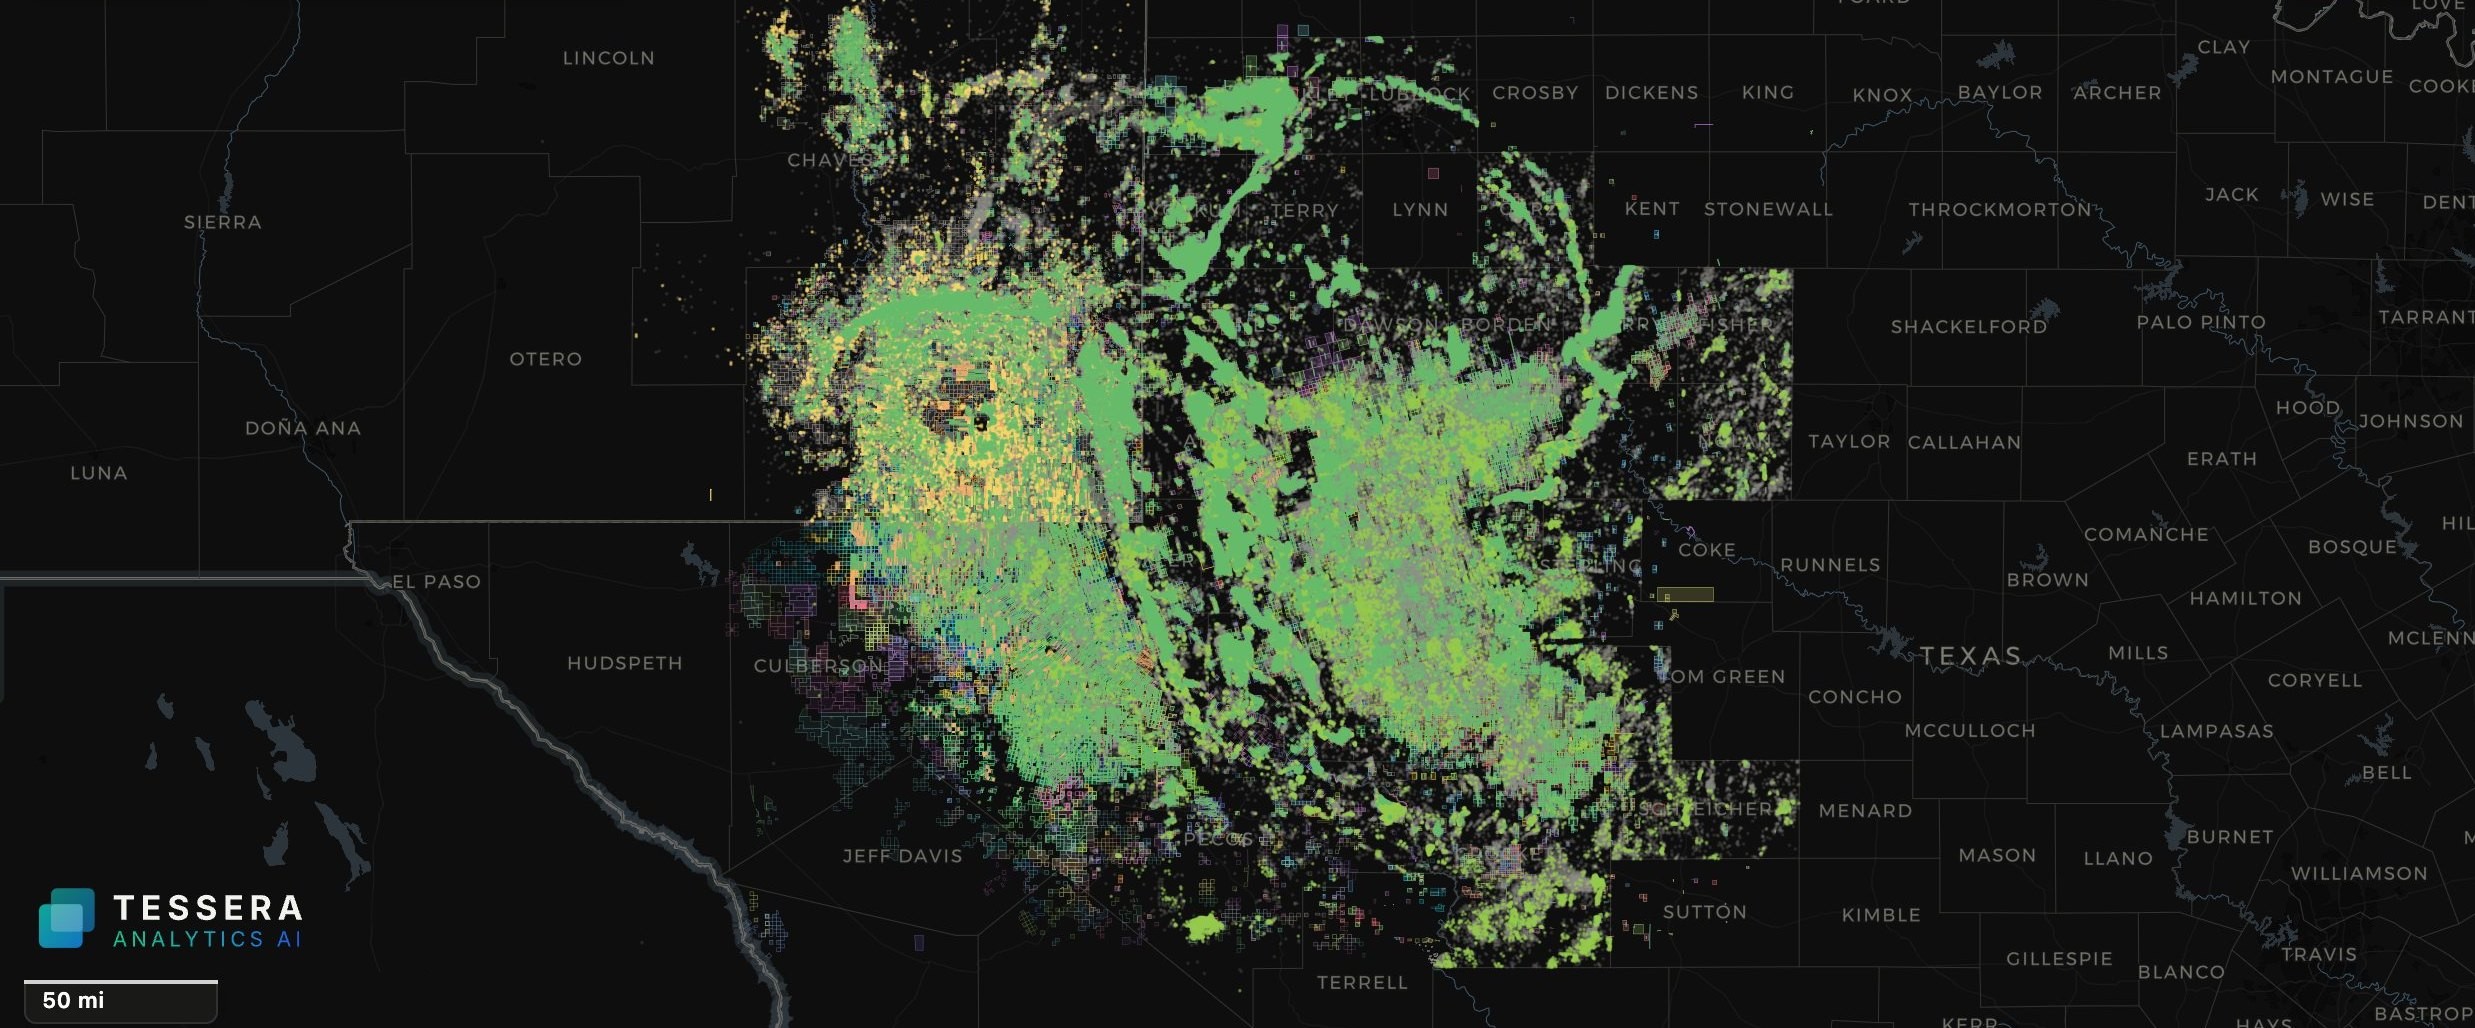
The whole basin in one view. More than 300,000 Permian wells colored by status: producing in green, permits in yellow, plugged in grey.
Capabilities
Operator benchmarking
Per-foot, per-stage and per-dollar performance by operator, zone, vintage and county, with the confounders removed.
Cohort comparison
Define two sets of wells and get the additive explanation of the gap: rock, spacing, completion, timing.
Driver analysis
Feature importance and partial effects on real wells, so every driver traces back to something on the map.
Diagnostics
Distributions, correlations, hexbins and bench classification before any model is trained.
Spacing physics
Voronoi drainage, lateral-to-lateral distance, encroachment and parent-child timing computed for every well.
See your wells and basin in Tessera.
A 30-minute walkthrough on your acreage, your operators or your deal. No slide deck, just the platform.