
See the whole basin. Then the one section that matters.
Part of Tessera QuestEvery horizontal, every lease, every zone, every month of production, on one map you can question. Filter by operator, vintage, landing zone, county, lateral length or anything else Tessera computes.
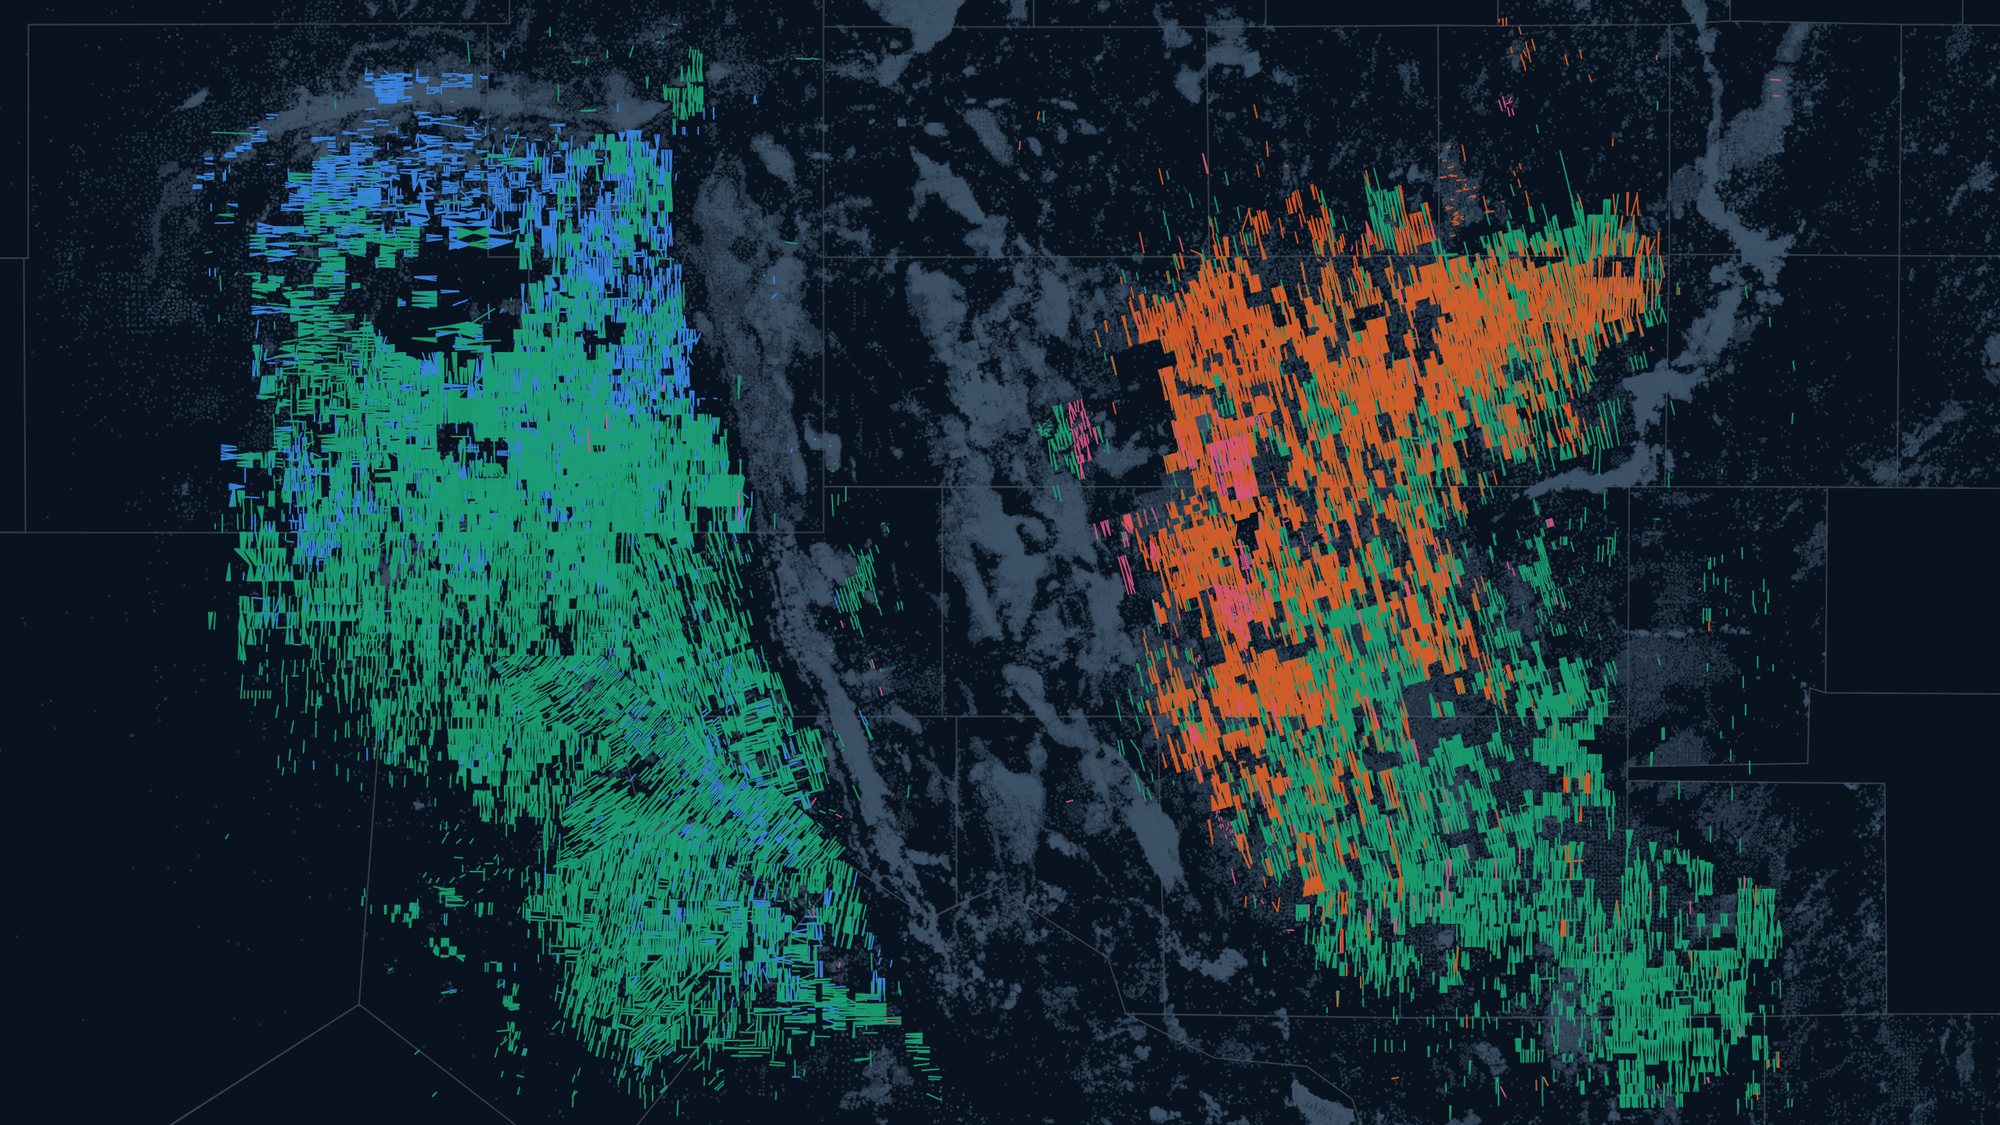

Start from the question.
The machinery stays underneath. You ask; Tessera pulls the wells, runs the numbers and shows the map.
- 01Who is drilling around our acreage right now?
- 02Which landing zones is Operator A targeting in Lea County this year?
- 03Where did lateral lengths cross 12,000 ft first?
- 04Show me every 2024 Wolfcamp B well within three miles of this pad.
This is the product, not a mockup.
Tessera Quest running on Tessera Data. A real screen, real wells.
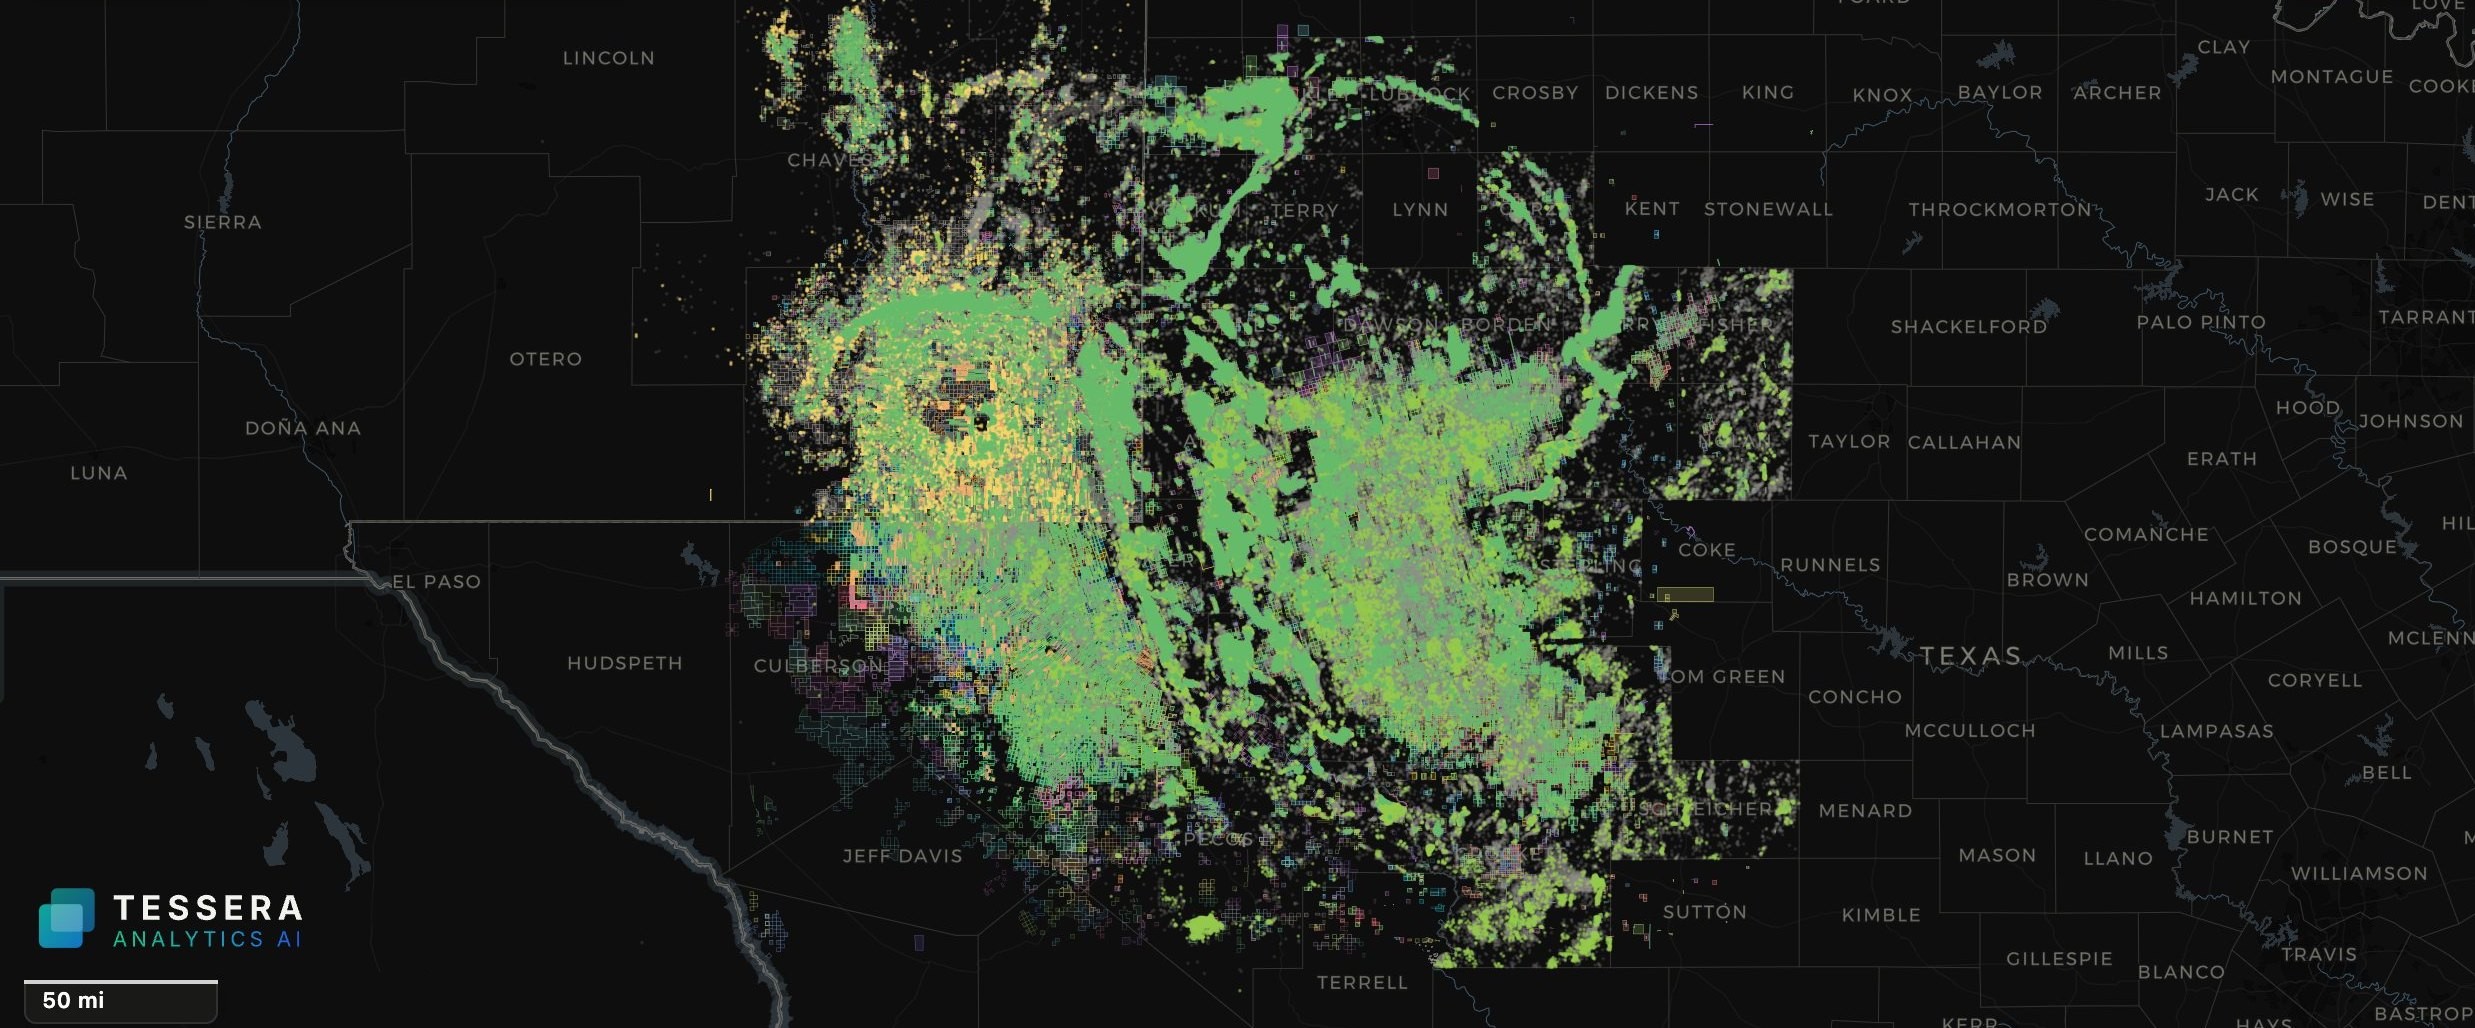
The whole basin in one view. More than 300,000 Permian wells colored by status: producing in green, permits in yellow, plugged in grey.
Capabilities
Basin-scale map
Tens of thousands of laterals render in under two seconds, colored by any attribute. Zoom from the basin to a single wellbore without changing tools.
Layers that mean something
Sections, leases, company acreage, midpoint surface tops, stress orientations, inventory grids and non-horizontal wells, each one a toggle.
Filters that stack
Operator, county, sub-basin, zone, vintage, lateral length, and any engineered attribute. Draw a polygon or import a shapefile to define an area.
Production in context
Cumulative curves, rate versus cumulative, and basin charts that re-aggregate to whatever wells you have selected.
Tables when you need them
Every column behind the map is one click away, sortable and exportable.
See your wells and basin in Tessera.
A 30-minute walkthrough on your acreage, your operators or your deal. No slide deck, just the platform.